


Create successful ePaper yourself
Turn your PDF publications into a flip-book with our unique Google optimized e-Paper software.
ad<br />
serie<br />
WP-AD 2013-03<br />
Centralization and Accountability:<br />
Theory and Evidence from the Clean Air Act<br />
Federico Boffa, Amedeo Piolatto and Giacomo A.M. Ponzetto<br />
Working papers<br />
g papers<br />
Working papers
Los documentos de trabajo del <strong>Ivie</strong> ofrecen un avance de los resultados de las<br />
investigaciones económicas en curso, con objeto de generar un proceso de<br />
discusión previo a su remisión a las revistas científicas. Al publicar este<br />
documento de trabajo, el <strong>Ivie</strong> no asume responsabilidad sobre su contenido.<br />
<strong>Ivie</strong> working papers offer in advance the results of economic research under way<br />
in order to encourage a discussion process before sending them to scientific<br />
journals for their final publication. <strong>Ivie</strong>’s decision to publish this working paper<br />
does not imply any responsibility for its content.<br />
La Serie AD es continuadora de la labor iniciada por el Departamento de<br />
Fundamentos de Análisis Económico de la Universidad de Alicante en su<br />
colección “A DISCUSIÓN” y difunde trabajos de marcado contenido teórico.<br />
Esta serie es coordinada por Carmen Herrero.<br />
The AD series, coordinated by Carmen Herrero, is a continuation of the work<br />
initiated by the Department of Economic Analysis of the Universidad de<br />
Alicante in its collection “A DISCUSIÓN”, providing and distributing papers<br />
marked by their theoretical content.<br />
Todos los documentos de trabajo están disponibles de forma gratuita en la web<br />
del <strong>Ivie</strong> http://www.ivie.es, así como las instrucciones para los autores que<br />
desean publicar en nuestras series.<br />
Working papers can be downloaded free of charge from the <strong>Ivie</strong> website<br />
http://www.ivie.es, as well as the instructions for authors who are interested in<br />
publishing in our series.<br />
Versión: 2013 / Version: 2013<br />
Edita / Published by:<br />
Instituto Valenciano de Investigaciones Económicas, S.A.<br />
C/ Guardia Civil, 22 esc. 2 1º - 46020 Valencia (Spain)
WP-AD 2013-03<br />
Centralization and Accountability: Theory and<br />
Evidence from the Clean Air Act <br />
Federico Boffa, Amedeo Piolatto and Giacomo A.M. Ponzetto **<br />
Abstract<br />
This paper studies fiscal federalism when voter information varies across regions. We develop a<br />
model of political agency with heterogeneously informed voters. Rent-seeking politicians provide<br />
public goods to win the votes of the informed. As a result, rent extraction is lower in regions with<br />
higher information. In equilibrium, electoral discipline has decreasing returns. Thus, political<br />
centralization reduces aggregate rent extraction. When the central government provides public<br />
goods uniformly across space, the model predicts that a region’s benefits from centralization are<br />
decreasing in its residents’ information. We test this prediction using panel data on pollutant<br />
emissions and newspaper circulation across the United States. The 1970 Clean Air Act centralized<br />
environmental policy at the federal level. In line with our theory, we find that centralization induced<br />
a faster decrease in pollution in less informed states.<br />
Keywords: Political centralization, Government accountability, Imperfect information, Interregional<br />
heterogeneity, Elections, Environmental policy, Air pollution.<br />
JEL classification numbers: D72, D82, H73, H77, Q58.<br />
We are grateful to Peter Backus, Paula Bustos, Vasco Carvalho, Edward Glaeser, Matthew Kahn, Gianmarco León, Ana<br />
Nuevo-Chiquero, Luigi Pascali, Diego Puga, Thijs van Rens, Kurt Schmidheiny, Hannes Schwandt, Paolo Surico, Yanos<br />
Zylberberg, and seminar participants at CEMFI, CREI, Erasmus University Rotterdam, IMT Lucca, Toulouse School of<br />
Economics, and UPF for helpful comments. We are indebted to Mark Strazicich for sharing data with us. Piolatto<br />
acknowledges financial support from <strong>Ivie</strong>, the Spanish Ministry of Science and Innovation (grant ECO-2012-37131), and the<br />
Generalitat de Catalunya (grant 2009 SGR 102). Ponzetto acknowledges financial support from the Spanish Ministry of Science<br />
and Innovation (grants ECO-2011-25624 and Juan de la Cierva JCI-2010-08414), the Barcelona GSE Research Network and the<br />
Generalitat de Catalunya (2009 SGR 1157).<br />
** F. Boffa: Università di Macerata and Barcelona Institute of Economics (IEB) (federico.boffa@unimc.it). A. Piolatto: IEB,<br />
Universitat de Barcelona (piolatto@ub.edu). G.A.M. Ponzetto: CREI, Universitat Pompeu Fabra, and Barcelona GSE<br />
(gponzetto@crei.cat).<br />
3
1 Introduction<br />
The most dramatic episode of centralization undertaken by the U.S. federal government<br />
achieved a striking decrease in corruption. The New Deal, by introducing federal oversight<br />
of welfare spending, eradicated the patronage and political manipulation that had hitherto<br />
characterized relief programs managed at the state and local level (Wallis 2000, 2006;<br />
Wallis, Fishback, and Kantor 2006). International evidence highlights similar instances<br />
of a positive impact of political centralization on government accountability. Centralized<br />
political institutions in precolonial Africa reduced corruption and fostered the rule of law,<br />
causing a long-lasting increase in the provision of public goods that endured into the postcolonial<br />
period (Gennaioli and Rainer 2007a,b). Fiscal centralization was a key element<br />
in the modernization of European states: it proved a necessary step for the consolidation<br />
of state capacity, which was in turn a critical determinant of economic development<br />
(Dincecco 2011; Gennaioli and Voth 2011; Dincecco and Katz 2012). In recent decades,<br />
Blanchard and Shleifer (2001) argue that China grew faster than Russia thanks to the<br />
greater strength of its central government compared to local politicians. While contemporary<br />
cross-country studies of decentralization and perceived corruption have yielded<br />
conflicting results (Treisman 2007; Fan, Lin, and Treisman 2009), it is clear empirically<br />
that centralization can increase government effi ciency and political accountability, at least<br />
under the appropriate conditions.<br />
This phenomenon is diffi cult to understand through the lens of traditional models of<br />
fiscal federalism. Oates’s (1972, 1999) classic theory does not consider the problem of<br />
imperfectly accountable politicians and posits two technological rationales for centralization:<br />
economies of scale and benefits from policy coordination. The subsequent literature<br />
in political economy has mostly emphasized the advantages of decentralization (Lockwood<br />
2006). In particular, decentralized government is supposed to be more accountable<br />
thanks to yardstick competition across local jurisdictions (Besley and Case 1995; Besley<br />
and Smart 2007). 1<br />
In this paper, on the other hand, we explain how centralization can in fact enhance<br />
accountability. Our approach reflects for electoral incentives the fundamental intuition of<br />
gains from trade between heterogeneous agents. Voters in different regions are unequally<br />
capable of incentivizing self-interested politicians. If the regions are united in a single<br />
national polity, the central politician is mainly held accountable by the most capable<br />
voters. Hence, his incentives and performance are better than those of the average local<br />
politician.<br />
voters.<br />
We capture this idea through a model of political agency with imperfectly informed<br />
Selfish politicians may misallocate personal effort and government resources,<br />
1 Conversely, the central government could be less susceptible to capture by special interest groups.<br />
However, formal analysis of this possibility has reached ambiguous conclusions (Bardhan and Mookherjee<br />
2000, 2006).<br />
3<br />
4
extracting wasteful private rents instead of providing public goods. Such rent-seeking<br />
behavior is constrained by electoral discipline. Career concerns induce the incumbent<br />
to provide public goods in order to signal ability and win the votes of those citizens<br />
who observe public goods provision. In equilibrium, we show that politicians extract<br />
lower rents if voters are better informed, consistent with empirical evidence that voter<br />
information improves accountability (Besley and Burgess 2002; Adserà, Boix, and Payne<br />
2003; Ferraz and Finan 2008; Snyder and Strömberg 2010; Ponzetto 2011). Our model<br />
proves that the link between voter information and political accountability is subject to<br />
decreasing returns, because the threat of being ousted from offi ce is less costly when rent<br />
extraction is already low. National elections, therefore, provide much better incentives<br />
and screening than local elections in the least informed regions, and not much worse than<br />
in the most informed ones. Centralization then increases overall effi ciency by reducing<br />
aggregate political rents.<br />
Our theory also accounts for the regional distribution of the effi ciency gains from<br />
centralization. When the central government provides public goods uniformly throughout<br />
the union, lower-information regions enjoy a transfer of accountability from their more<br />
informed partners. We prove that a region’s welfare gains from centralization are then<br />
strictly decreasing in its residents’information. Conversely, if the central government can<br />
provide public goods dishomogeneously across space, higher-information regions enjoy a<br />
transfer of power from their less informed peers. The central government then targets<br />
spending to the informed voters who monitor it most closely, consistent with Strömberg’s<br />
(2004) evidence that discretionary New Deal funds were disproportionately allocated<br />
to more informed counties within each state. Our theory highlights the importance<br />
of striking a balance between uniform and discretionary public goods provision at the<br />
central level. Without any uniformity, centralization would be welfare reducing despite<br />
the associated reduction in political rents. Given the right balance between uniform and<br />
discretionary items, instead, centralization can be not only welfare increasing but also<br />
Pareto effi cient.<br />
Our model predicts that each region should benefit in inverse proportion to its residents’information<br />
when the central government is empowered to set a uniform policy<br />
for the whole union. We test this prediction by studying one of the most prominent<br />
instances of centralization in the history of the United States since World War II (Greenstone<br />
2004). The Clean Air Act of 1970 transferred responsibility for pollution regulation<br />
from the state and local governments to the federal Environmental Protection Agency.<br />
We perform a difference-in-differences analysis using panel data on pollution and newspaper<br />
circulation across states.<br />
The empirical evidence supports our theoretical prediction: the federal takeover of environmental<br />
policy had a significant differential impact on states according to their level<br />
of information. After national air-quality standards were introduced in 1970, pollutant<br />
4<br />
5
emissions begin to decline, relative to pre-existing trends, considerably faster in states<br />
with lower newspaper readership. This finding obtains for different pollutant, and it is<br />
robust to a wide range of controls for state-specific economic structure and political ideology.<br />
In line with our theory, the differential reduction in emissions seems to represent a<br />
benefit of centralization for the uninformed, since we find no evidence of displacement effects<br />
across states. Information does not account for a differential contraction in economic<br />
activity after 1970, neither in the aggregate nor for specific polluting industries.<br />
2 Theoretical Model<br />
2.1 Political Agency and Public Goods Provision<br />
The economy is populated by infinitely lived agents, whose preferences are separable over<br />
time and quasilinear across a set of public goods p = 1, ..., P . Individual i in period t<br />
derives instantaneous utility<br />
u i t = ũ i t +<br />
P∑<br />
α i p log g p,t , (1)<br />
p=1<br />
where ũ i t is utility from private consumption, and g p,t the provision of public good p.<br />
The relative importance of each good for individual i is described by the shares α i p ≥ 0<br />
such that ∑ P<br />
p=1 αi p = 1. We focus on public goods provision, treating ũ i t as an exogenous<br />
shock.<br />
Public goods are produced by the government with technology<br />
g p,t = e η p,t xp,t . (2)<br />
The production technology has constant returns to scale: x p,t measure per capita investment<br />
in each public good p. Thus, we do not consider economies of scale in public<br />
goods provision, which would provide an immediate technological rationale for effi cient<br />
centralization.<br />
Productivity η p,t represents the stochastic competence of the incumbent politician in<br />
providing good p. It is independent across public goods, and follows a first-order moving<br />
average process<br />
η p,t = ε p,t + ε p,t−1 . (3)<br />
The shocks ε p,t are independent and identically distributed across policies, over time, and<br />
across politicians. They have support [ˇε, ˆε], mean zero and variance σ 2 .<br />
5<br />
6
Politicians are self-interested rent-seekers. Each period, the incumbent extracts a rent<br />
P∑<br />
r t = b − x p,t . (4)<br />
The simplest interpretation of rent extraction is pecuniary. The incumbent allocates a<br />
given government budget b, invariant over time and subject to a balanced-budget constraint.<br />
Each period he spends an amount x p,t on the provision of each public good, and<br />
devotes the remainder r t to socially unproductive ends ranging from party finance to outright<br />
embezzlement (Persson and Tabellini 2000). While this reading is perhaps the most<br />
intuitive, the model can identically represent slacking instead of stealing. The incumbent<br />
enjoys an invariant exogenous reward b from holding offi ce, including compensation and<br />
perks as well as the “ego rent” of being in power. However, he incurs a cost x p,t from<br />
exerting effort to provide each public good. Rent extraction r t then captures his failure<br />
to work diligently in his constituents’interest.<br />
The politician’s objective is to maximize rent extraction over his term in offi ce. He<br />
discounts future rents by the discount factor δ ∈ (0, 1]. He faces election at the end of<br />
each period, and if ousted he will never return to power. Politicians lack the ability to<br />
make credible policy commitment, so the election is not based on campaign promises,<br />
but rather on retrospective evaluation of the incumbent’s track record. Current rentextraction<br />
is disciplined by career concerns: the incumbent invests in providing public<br />
goods because their provision signals his ability and thereby increases his chances of reelection<br />
(Holmström [1982] 1999; Persson and Tabellini 2000). In the standard model of<br />
political career concerns, all voters observe the level of public goods provision. We relax<br />
the assumption of perfect information, and assume instead that each voter i reaches the<br />
election with rational expectations based on incomplete and heterogeneous information<br />
according to the following timeline.<br />
p=1<br />
1. The incumbent politician’s past competence shock ε t−1 becomes common knowledge.<br />
2. The incumbent chooses investments x t , and residually rent r t , without knowing the<br />
realization of his period-t competence shock ε t .<br />
3. ε t is realized and the provision of public goods g t is determined. Each voter i<br />
observes g t with probability θ i ; with probability 1 − θ i he remains completely uninformed.<br />
2<br />
The arrival of information is independent across voters. No voter has<br />
any direct observation of ε t , r t , or x t .<br />
2 This is not inconsistent with knowledge of one’s own utility u i t. The exogenous component ũ i t may<br />
include a stochastic shock, and uninformed voters are unable to distinguish between the effects of the<br />
shock and those of g t .<br />
6<br />
7
4. An election is held, pitting the incumbent against a single challenger, randomly<br />
drawn from the same pool of potential offi ce-holders.<br />
The electorate consists of a continuum of atomistic voters. It can be partitioned into<br />
J internally homogeneous groups. Group j comprises a fraction λ j of voters, who have<br />
identical preferences α j , and identical probabilities θ j of information acquisition. We<br />
allow for an intensive margin of political support, following the probabilistic voting approach<br />
(Lindbeck and Weibull 1987). Each voter’s preferences consist of two independent<br />
elements.<br />
First, agents have preferences Eu i t+1 over the provision of public goods they expect<br />
from either politician in the following period. Given information Ω i t, individual i has<br />
policy preferences<br />
[<br />
( ) P<br />
]<br />
∑ ( )<br />
∆ i Ω<br />
i<br />
t ≡ E α i p log g<br />
I<br />
p,t+1 − log gp,t+1<br />
C |Ω<br />
i<br />
t , (5)<br />
p=1<br />
where gp,t+1 I denotes public goods provision if the incumbent is re-elected, and gp,t+1 C if<br />
the challenger defeats him.<br />
In addition, voters have preferences for candidates’non-policy characteristics, such as<br />
their individual likability or the long-standing ideology of their party. Thus, voter i votes<br />
for the incumbent if and only if<br />
∆ i<br />
(<br />
Ω<br />
i<br />
t<br />
)<br />
≥ Ψt + ψ i t, (6)<br />
where Ψ t and ψ i t are independent draws from common-knowledge probability distributions.<br />
The common shock Ψ t to the incumbent’s popularity accounts for the aggregate<br />
uncertainty in the electoral outcome. The idiosyncratic shock ψ i t to each voter’s tastes is<br />
i.i.d. across agents. Both variables have uniform distributions with supports respectively<br />
[−1/ (2φ) , 1/ (2φ)] and [ −¯ψ, ¯ψ ] , suffi ciently wide that in a rational expectations equilibrium<br />
neither any voter’s ballot nor the outcome of the election are perfectly predictable<br />
on the basis of policy considerations alone.<br />
Assumption 1 The support of the electoral shocks Ψ t and ψ i t is suffi ciently wide, and<br />
that of the competence shocks ε p,t suffi ciently narrow, that<br />
where<br />
1<br />
2φ − ¯ψ ≤ ˇε < ˆε ≤ ¯ψ − 1<br />
2φ and − 1<br />
2φ ≤ ˇε¯θ < ˆε¯θ ≤ 1<br />
2φ ,<br />
denotes voters’average information.<br />
¯θ =<br />
∑ J<br />
j=1 λ jθ j<br />
7<br />
8
2.2 Voter Information and Government Accountability<br />
The incumbent’s and the challenger’s competence shocks are known to be independent<br />
draws from a common distribution. Moreover, voters have rational expectations that any<br />
politician in every period will choose the same allocation ¯x, because the environment is<br />
stationary and performance is separable in effort and ability. Voter i’s information is<br />
described by Ω i t ∈ {0, 1}, a binary variable that describes whether he observed public<br />
goods provision g t .<br />
Since no information about the challenger is available, all voters have rational expectations<br />
E<br />
[ P<br />
∑<br />
α i p<br />
p=1<br />
]<br />
( )<br />
P∑<br />
log g<br />
C<br />
p,t+1 |Ω<br />
i<br />
t = α i p log ¯x p . (7)<br />
Uninformed voters also have no way of assessing the incumbent’s skill innovation ε t ,<br />
and thus his future ability η t+1 . Hence they rationally perceive the incumbent and the<br />
challenger as identical from the perspective of future public goods provision:<br />
p=1<br />
∆ i (0) = 0. (8)<br />
Informed voters, instead, can infer from g t the incumbent’s competence η p,t . Their<br />
policy preferences are therefore<br />
∆ i (1) =<br />
P∑<br />
α i pE (ε p,t |g p,t ) =<br />
p=1<br />
P∑<br />
α i p (log g p,t − log ¯x p − ε p,t−1 ) . (9)<br />
p=1<br />
In a rational expectations equilibrium their inference turns out to be perfect, accurately<br />
revealing ε t .<br />
Each group j comprises a continuum of agents and the arrival of information is independent<br />
across agents, so a share θ j of its members have observed public goods provision<br />
g t , while the remainder 1−θ j have not. Given the independent realizations of the uniform<br />
idiosyncratic shock ψ i , the share of members of group j who vote for the incumbent is<br />
[<br />
v j t = 1 2 + 1 θ j<br />
2¯ψ<br />
P<br />
∑<br />
p=1<br />
α j p (log g p,t − log ¯x p − ε p,t−1 ) − Ψ t<br />
]<br />
, (10)<br />
conditional on the realizations of g t and Ψ t . Taking into account the uniform aggregate<br />
shock Ψ t , the incumbent’s probability of re-election is<br />
π (x t ) = 1 J∑<br />
2 + φ λ j θ j<br />
j=1<br />
P<br />
∑<br />
p=1<br />
α j p (log x p,t − log ¯x p ) (11)<br />
as a function of his policy choices x t (and residually r t ).<br />
8<br />
9
The politician understands that if he is re-elected he will have further occasions to<br />
extract rents. Denote by R their (endogenous) expected present value. The trade-off<br />
between current and future rent extraction leads to policy choices<br />
{<br />
x = arg max b −<br />
x t<br />
}<br />
P∑<br />
x p,t + Rπ (x t ) , (12)<br />
p=1<br />
namely<br />
J∑<br />
x p = φR λ j θ j α j p for all p = 1, ..., P , (13)<br />
j=1<br />
and thus current rent extraction<br />
r = b − φ¯θR. (14)<br />
In equilibrium, the probability of re-election is 1/2 because the politician does not have<br />
private information at the time of the policy choice, voters have rational expectations,<br />
and their non-policy tastes do not have a permanent bias against incumbency nor in its<br />
favor. As a consequence, the present value of re-election is<br />
R = δ<br />
∞∑<br />
( ) t δ<br />
r = 2δ r. (15)<br />
2 2 − δ<br />
t=0<br />
Substituting this relationship into equations 13 and 14, solving the latter, and plugging<br />
it into the former, we obtain the equilibrium allocation of the government budget. To<br />
economize on notation, we define<br />
˜δ ≡<br />
δ<br />
2 − δ<br />
a convenient rescaling of the politician’s discount factor.<br />
∈ (0, 1] , (16)<br />
Finally, rational expectations imply that the incumbent is re-elected if and only if<br />
Ψ t ≤<br />
J∑<br />
λ j θ j<br />
j=1<br />
P<br />
∑<br />
p=1<br />
α j pε p,t . (17)<br />
Let χ t be an indicator variable for this condition. The competence of ruling politicians<br />
evolves according to<br />
ˆη t = χ t−1<br />
(<br />
ε<br />
I<br />
t−1 + ε I t<br />
)<br />
+<br />
(<br />
1 − χt−1<br />
) (<br />
ε<br />
C<br />
t−1 + ε C t<br />
)<br />
, (18)<br />
where the superscripts I and C refer to the incumbent and challenger in the election at<br />
the end of period t − 1. The unconditional expectation of ability is then<br />
Eˆη p,t = E ( χ t−1 ε p,t−1<br />
)<br />
. (19)<br />
9<br />
10
This completes the characterization of the stationary equilibrium of our model of<br />
political career concerns.<br />
Proposition 1 In equilibrium, the politician extract rents r = ρb, with rent extraction<br />
ρ ≡<br />
( ) −1<br />
1 + 2˜δφ¯θ<br />
He sets investment in the provision of public good p to x p = β p (1 − ρ) b, with relative<br />
shares<br />
β p ≡<br />
J∑<br />
j=1<br />
His expected ability at providing public good p is<br />
Eˆη p = φσ 2 ∑ J<br />
λ j<br />
θ j<br />
¯θ<br />
α j p.<br />
j=1 λ jθ j α j p.<br />
An increase in φ ∑ J<br />
j=1 λ jθ j α j p induces an increase in ˆη p in the sense of first-order stochastic<br />
dominance.<br />
The key result in the proposition is that rent extraction declines as voters are more<br />
informed (∂ρ/∂¯θ < 0). Intuitively, information allows voters to monitor the politician<br />
more tightly. This result accords with the empirical finding that government performance<br />
improves with media scrutiny (Besley and Burgess 2002; Adserà, Boix, and Payne 2003;<br />
Ferraz and Finan 2008; Snyder and Strömberg 2010; Ponzetto 2011). Nevertheless, this<br />
link between greater information and better governance does not suffi ce to create incentives<br />
for agents to acquire political information, due to the paradox of the rational voter.<br />
Since each voter has a negligible (in the model, precisely nil) chance of determining the<br />
outcome of the election, he also has vanishing incentives to improve his monitoring ability.<br />
Thus, the decision to acquire information ¯θ is not endogenous to the election game, but<br />
derives from exogenous characteristics of the electorate. On these lines, Putnam (1993)<br />
argues that newspaper readership reflects an individual’s civic involvement and social<br />
capital.<br />
Rent extraction is also reduced when voters are more likely to be swayed by policy<br />
than non-policy considerations (∂ρ/∂φ < 0). Then politicians realize their chances of<br />
re-election depend more on their perceived competence and less on their likability, and<br />
accordingly strive to provide more public goods. Finally, rent extraction declines when<br />
patience is greater (∂ρ/∂δ < 0). Then politicians are more willing to sacrifice current<br />
benefits for a higher probability of remaining in offi ce in the future.<br />
It is impossible to reduce rent extraction to zero because the incumbent’s incentive to<br />
refrain from extreme rent extraction (x t = 0) is entirely due to his desire to gain reelection<br />
and keep extracting rents in the future. More broadly, reductions in rent extraction<br />
10<br />
11
through electoral discipline become progressively more diffi cult as the equilibrium rent<br />
declines. All rent-decreasing factors, namely information ¯θ, voters’keenness of competence<br />
φ, and patience δ, have positive but decreasing returns (∂ 2 ρ/∂¯θ 2 > 0, ∂ 2 ρ/∂φ 2 > 0,<br />
∂ 2 ρ/∂δ 2 > 0).<br />
The same factors that make elections a better incentive device also make them a better<br />
screening mechanism. Average government productivity is proportional to the variance<br />
of the underlying distribution of ability (σ 2 ), which measures the gains available from<br />
screening. The effectiveness of screening rises when voters are more informed about public<br />
goods provision (∂Eˆη p /∂θ j > 0), and thus have the ability to cast their ballots on the basis<br />
of a signal of the incumbent’s skill. Moreover, screening is more effective when citizens are<br />
more willing to vote on the basis of observed performance, rather than out of idiosyncratic<br />
non-policy tastes (∂Eˆη p /∂φ > 0). These effects raise not only the expectation of ability,<br />
but its entire distribution, in the sense of first-order stochastic dominance. While the<br />
unconditional probability of re-election is always equal to 1/2, it becomes monotonically<br />
more likely that capable incumbents are retained and incompetent ones thrown out.<br />
Instead, in the limit case of no information (¯θ = 0), the probability of re-election reflects<br />
the popularity shock Ψ t alone. Then it equals 1/2 not only unconditionally, but also<br />
conditional on any realization of ε t .<br />
Through improvements in both political incentives and political selection, higher average<br />
information (¯θ) increases Equilibrium utility is given by<br />
Eu j =<br />
P∑<br />
α j pE log g p,t = log b + log (1 − ρ) +<br />
P∑<br />
p=1<br />
p=1<br />
α j p<br />
(<br />
Eˆηp + log β p<br />
)<br />
(20)<br />
for each member of group j. An equiproportional increase in the information of each<br />
voter (θ j ) unambiguously raises the welfare of all. Both political incentives and political<br />
selection improve (∂ρ/∂¯θ < 0 and ∂Eˆη p /∂θ j > 0), while investment shares β are<br />
unchanged. Welfare also rises with voters’keenness on policy outcomes (φ), politicians’<br />
patience (δ), and the variance of their ability distribution (σ 2 ).<br />
Finally, proposition 1 shows that the share β p of each public good reflects differences<br />
in both preferences and information across voters. A utilitarian social welfare planner<br />
would set<br />
β p = ᾱ p ≡ ∑ J<br />
λ jα j p, (21)<br />
j=1<br />
reflecting average preferences for each public good. However, politicians are only imperfectly<br />
accountable, and specifically they are held accountable only by informed voters.<br />
Thus, their choices deviate from social welfare optimization even beyond the extraction<br />
of a rent. The allocation of investment across public goods obey a social welfare function<br />
in which each group’s preferences are weighted by its relative level of information (θ j /¯θ).<br />
This result mirrors the finding that information translates into a group’s power over po-<br />
11<br />
12
litical issues such as the allocation of discretionary expenditure (Strömberg 2004), the<br />
influence of religion in politics (Glaeser, Ponzetto, and Shapiro 2005), or the structure of<br />
trade policy (Ponzetto 2011)<br />
2.3 Centralization and Rent Extraction<br />
To examine the effect of political centralization or decentralization on rent extraction and<br />
public goods provision, we consider and economy divided into L regions There are then<br />
LP public goods: their indexing is expanded so that g l,p,t is the provision of public good p<br />
in location l at time t. Politicians are drawn independently across regions, from identical<br />
pools.<br />
In keeping with the classic theory of fiscal federalism (Oates 1972), we admit the<br />
possibility of externalities in public goods provision. These externalities are measured by<br />
an index ξ p ∈ [0, 1]. A resident of region l derives utility<br />
(<br />
α l l,p = 1 − L − 1 )<br />
L<br />
ξ p α l p > 0 (22)<br />
from public goods provided to his own region, but he may also derive additional utility<br />
α l m,p = 1 L ξ pα l p for l ≠ m (23)<br />
from public goods provided in any other region. Thus we can write the utility of individual<br />
i in region l as<br />
u i t = ũ i t +<br />
P∑<br />
p=1<br />
α l p<br />
[<br />
(1<br />
− ξp<br />
)<br />
log gl,p,t + ξ p<br />
L<br />
]<br />
L∑<br />
log g m,p,t . (24)<br />
m=1<br />
With decentralized government, in each region l a local politician with ability η D l,p,t<br />
independently invests in the provision of public goods x D l,p,t and extracts rent<br />
P∑<br />
rl,t D = b − x D l,p,t. (25)<br />
Following proposition 1, we measure rent extraction in region l under decentralization by<br />
ρ D l<br />
p=1<br />
= r D l /b. This can be immediately interpreted as the fraction of the regional budget<br />
b that the politician misallocates. Identically, as discussed above, it could measure the<br />
extent to which the local politician enjoys the rewards of offi ce b without exerting effort<br />
x D l,p,tĊentralization means that a single politician with ability ηC p,t chooses investment in<br />
12<br />
13
public goods x C l,p,t for all l. and extracts rents<br />
r C t<br />
= bL −<br />
L∑ P∑<br />
x C l,p,t. (26)<br />
l=1 p=1<br />
If we interpret rent rent-extraction simply as stealing, the size of the central politician’s<br />
rent follows immediately because he controls under centralization the same aggregate<br />
budget (bL) as the sum of local politicians under decentralization. Under the alternative<br />
slacking interpretation, this expression corresponds to the additional assumption that the<br />
perks and ego rents of offi ce are similarly additive. In either case, rent extraction under<br />
centralization can be measured by ρ C = r C / (bL), which has the same normalization as<br />
ρ D l .<br />
Centralization may also require the central government to provide public goods uniformly<br />
across regions (x C l,p,t = x C p,t for all l, implying g C l,p,t = g C p,t given the common<br />
competence η C p,t). The literature has typically assumed such a uniformity constraint, and<br />
underlined that it provides a simple rationale for decentralization given heterogeneous<br />
preferences across regions (Oates 1972; Alesina and Spolaore 1997; Alesina, Angeloni,<br />
and Etro 2005).<br />
Nonetheless, imposing a uniformity constraint on centralized public<br />
goods provision is not necessarily realistic in all settings. Discretionary federal spending<br />
is not required to be allocated uniformly across states, almost by definition of discretionality.<br />
Lockwood (2002) and Besley and Coate (2003) have modelled fiscal federalism<br />
under the alternative hypothesis that the central government can arbitrarily vary the<br />
provision of public goods across regions. We encompass both cases by assuming that<br />
there is a set U of public goods whose centralized provision is exogenously subject to a<br />
uniformity constraint. The complementary set D consists of public goods that the central<br />
government can instead provide in different amounts to different regions.<br />
The following proposition establishes the beneficial effect of centralization on political<br />
accountability, which is independent of the presence of a uniformity constraint.<br />
Proposition 2 Aggregate rent extraction is lower under centralization than decentralization<br />
(ρ C ≤ ∑ L<br />
l=1 ρD l /L). It is strictly lower if information is heterogeneous across regions<br />
(θ l ≠ θ m for some l ≠ m), or if there are externalities in public goods provision (ξ p > 0<br />
for some p).<br />
Average effi ciency in providing each public good is higher under centralization than<br />
decentralization (Eˆη C p ≥ ∑ L<br />
l=1 EˆηD l,p/L). It is strictly higher if there are externalities in<br />
public goods provision (ξ p > 0).<br />
The first and key result in the proposition is that if voters are heterogeneously informed<br />
(θ l ≠ θ m for l ≠ m), and thus politicians are heterogeneously accountable, centralization<br />
has beneficial aggregate effects on accountability. The decline in rent extraction<br />
13<br />
14
is an intuitive consequence of decreasing returns to monitoring. By joining heterogeneous<br />
regions into a single polity, centralization leads to an overall level of political information<br />
equal to the average ¯θ of information across regions. For regions with low voter<br />
information, this represents a large improvement, because the increase in accountability<br />
is powerful given the low starting point of their political accountability under decentralization.<br />
For regions with high voter information, the deterioration is not equally stark,<br />
because the marginal value of information is low when it is plentiful to begin with. The<br />
aggregate effect of centralization is thus an unambiguous decrease in rent extraction.<br />
Centralization also increases political accountability if there are spillovers in public<br />
goods across regions (ξ l p > 0). Advantages of centralization in the presence of interregional<br />
externalities are present in all theories of federalism since Oates (1972). But the<br />
classic theory only considers the benefits of coordination, abstracting from any politicaleconomy<br />
considerations. Proposition 2 finds that spillovers improve incentives even if<br />
there is no need for policy coordination. When preferences are identical across regions<br />
(α l = α for all l), all voters agree on the optimal allocation across public goods. Benevolent<br />
planners would then attain the first best even if the maximized non-cooperatively<br />
each region’s welfare. With imperfect political agency, however, spillovers imply a benefit<br />
of centralization due to reduced rent extraction rather than inter-regional coordination.<br />
In the election, informed citizens are more likely to support the incumbent if he has<br />
proved to be more capable than average. The intensity of popular support, however,<br />
depends not only on the extent of ability, but also on its importance. A voter who<br />
is informed of the incumbent’s poor skills may nonetheless vote for him because of his<br />
personal likability or ideological affi nity. This is less likely, however, when the economic<br />
stakes in the election rise. If there are public goods spillovers, the stakes are higher<br />
in a national than in a local election. The ability of a local politician influences only<br />
local public goods; the ability of a central politician influences both local public goods<br />
and spillovers from other regions. A voter who cares about spillovers (ξ p > 0) will,<br />
therefore, be keener on electing a proficient politician at the central than at the regional<br />
level. Hence, centralization reduces the influence of non-policy preferences on electoral<br />
outcomes, improving the monitoring value of elections.<br />
Through the same channel, the screening value of elections also increases. Since voters<br />
are more concerned about the ability of a national than a local politician, in equilibrium<br />
they select a central government whose average ability (Eˆη p ) is greater. Thanks to centralization,<br />
not only wasteful rents decline, but the effi ciency of productive public spending<br />
simultaneously rises.<br />
Our results can be contrasted with Oates’s (1972) Decentralization Theorem. In his<br />
classic analysis, centralization is useful to internalize cross-regional externalities. Conversely,<br />
decentralization is beneficial to avoid the cost of policy uniformity when regions<br />
have heterogeneous preferences. If we follow the standard assumption that all pub-<br />
14<br />
15
lic goods provided by the central government are subject to the uniformity constraint<br />
(D = ∅), our framework replicates the standard results if and only if voters are homogeneously<br />
informed (θ l = θ for all l). With heterogeneous information, Proposition 2<br />
establishes new forces that tend to make centralization welfare increasing.<br />
Proposition 3 Suppose that all public goods provided by the central government are subject<br />
to the uniformity constraint (D = ∅) and that information is homogeneous across<br />
regions (θ l = θ for all l).<br />
1. If there are no externalities and preferences are homogeneous (α l p = α p for all l and<br />
ξ p = 0 for all p), then centralization and decentralization yield identical outcomes.<br />
2. If there are externalities and preferences are homogeneous (α l p = α p for all l, while<br />
ξ p > 0 for some p), then centralization yields higher welfare than decentralization.<br />
3. If there are no externalities and preferences are heterogeneous (ξ p = 0 for all p,<br />
while α l p ≠ α m p for some l ≠ m and p), then decentralization yields higher welfare<br />
than centralization.<br />
Suppose that all public goods provided by the central government are subject to the<br />
uniformity constraint (D = ∅) and that information is heterogeneous across regions (θ l ≠<br />
θ m for some l ≠ m). If preferences are homogeneous (α l p = α p for all l), centralization<br />
yields higher welfare than decentralization regardless of externalities (ξ p ≥ 0).<br />
The first three points coincide with Oates’s Decentralization Theorem. When there<br />
are neither heterogeneity nor spillovers in information, these classic results obtain in spite<br />
of the distortions arising from imperfect political agency.<br />
Without externalities, there are no benefits from policy coordination. With homogeneous<br />
preferences, there are no costs of policy uniformity. Furthermore, in this case<br />
imperfect agency causes the same distortions under centralization or decentralization.<br />
Constituency size affects political agency through two opposing forces (Seabright 1996;<br />
Persson and Tabellini 2000). Centralization reduces the probability that voters in any<br />
one region are pivotal in the election. Hence a central politician is less responsive to<br />
each voter’s preferences than a local politician is to those of his fewer constituents. Conversely,<br />
centralization increases the scale of political rent. When the politician allocates<br />
the larger central budget instead of a smaller regional budget, re-election is more valuable.<br />
A greater value of re-election sharpens the incentives for the central politician to<br />
perform well. Proposition 3 shows that these forces are perfectly balanced. Centralization<br />
expands the budget by a factor L, while reducing the electoral clout of each region by a<br />
factor 1/L. The politician’s incentives are thus invariant with respect to the scale of his<br />
constituency. Rent extraction is proportional to the government budget, as established<br />
in Proposition 1.<br />
15<br />
16
The second point of the Decentralization Theorem deals with the benefits of policy<br />
coordination. Oates (1972) assumed that local politicians maximize local welfare but<br />
are exogenously incapable of cooperating. In our model, even if local politicians could<br />
cooperate across regions, they would have no incentives to do so. Local politicians are<br />
uninterested in changing each other’s behavior. Their only goal is to signal their own ability<br />
to their own constituents, which they do most effectively by ignoring all externalities.<br />
Thus, Proposition 3 reflects an endogenous inability to internalize externalities under decentralization.<br />
In addition, Proposition 2 showed that the incentives and screening both<br />
improve under centralization when there are externalities in public goods provision.<br />
The third point highlights the standard cost of a binding uniformity constraint. When<br />
regions have heterogeneous preferences,uniformity implies a suboptimal allocation of expenditure<br />
across regions. Furthermore, with imperfect political agency a binding uniformity<br />
constraint also worsens electoral screening. Politicians’skill sets are more congruent<br />
with their constituents’preferences when they are elected locally rather than in a single<br />
national election.<br />
Proposition 3 concludes by showing that voter information generically modifies the<br />
findings of the Decentralization Theorem in favor of centralization. With homogeneous<br />
preferences, decentralization is strictly dominated not only when there are externalities,<br />
but also when information is heterogeneous across regions. Then it is no longer unambiguously<br />
true that decentralization is beneficial when preferences are heterogeneous: the<br />
costs of policy uniformity can be more than offset by the accountability benefits described<br />
by Proposition 2.<br />
2.4 The Distribution of Effi ciency Gains<br />
Proposition 2 highlighted the mechanisms through which centralization increases average<br />
political accountability and reduces rent extraction. Lower rents imply greater public<br />
goods provision, and accordingly Proposition 3 established that centralization is welfareincreasing<br />
from the national perspective when preferences are homogeneous and public<br />
goods are uniformly provided. A more thorough assessment of the consequences of centralization<br />
must take into account the uneven distribution of its benefits across regions.<br />
The distinction between uniform and discretionary public goods provision by the central<br />
government moves to the forefront in this analysis.<br />
A uniformity constraint implies that centralization transfers accountability from the<br />
more to the less informed regions. Thus, the welfare gains described by Proposition 3<br />
accrue disproportionately to the uninformed.<br />
Proposition 4 Suppose that all public goods provided by the central government are subject<br />
to the uniformity constraint (D = ∅), and that preferences are homogeneous but<br />
16<br />
17
information is heterogeneous across regions (α l p = α p for all l, while θ l ≠ θ m for some<br />
l ≠ m).<br />
If residents of region l are less informed than residents of region m, then centralization<br />
yields a greater increase in the expected provision of all public goods and thus in welfare<br />
in region l than in region m (θ l < θ m implies E ( gl,p C − (<br />
l,p) gD > E g<br />
C<br />
m,p − gm,p) D for all p<br />
and E ( ) ( )<br />
u C l − u D l > E u<br />
C<br />
m − u D m ).<br />
If furthermore there are no externalities in public goods provision (ξ p = 0 for all p)<br />
then region l is better off under centralization than decentralization if and only if its voters<br />
are less informed than average (θ l ≤ ¯θ ⇔ Eu C l ≥ Eu D l ).<br />
When voter information is heterogeneous, centralization reduces rent extraction by<br />
transferring political monitoring from the regions whose voters are more informed than<br />
average to those with less than average information. The more informed regions are better<br />
at incentivizing and selecting local politicians. Conversely, the less informed regions<br />
are plagued with rent-extracting and incompetent local governments. Centralization<br />
effectively enables them to outsource their governance to better informed voters in other<br />
regions.<br />
The overall impact of centralization on better informed regions is ambiguous. On the<br />
one hand, the average information exploited in electing their rulers falls when they join<br />
the less informed parts of the union in a national election. On the other hand, if public<br />
goods spill over across regions (ξ p > 0) all voters are more likely to act on the basis of<br />
whatever information they have in a national election. While the dilution of informed<br />
voters blunts the monitoring and screening ability of the electorate, externalities from<br />
central policy decisions sharpen it. The net effect is negative in the absence of spillovers,<br />
but it can be positive when they are present.<br />
Instead, regions with below-average information clearly gain from centralization. The<br />
implicit transfer of accountability effected by centralization effectively entails a welfareincreasing<br />
transfer of public resources, although every region contributes an equal amount<br />
(b) to the government budget and receives an identical provision of public goods (g). In<br />
fact, the transfer is precisely a consequence of this two-sided uniformity. Under decentralization,<br />
the contributions (b) are also identical, but less informed regions suffer much<br />
higher rent extraction and enjoy considerably lower productive government spending.<br />
Proposition 4 then implies that empowering the federal government to set a uniform<br />
nation-wide policy should benefit disproportionately the states with lower voter information.<br />
The next section tests this prediction with evidence from environmental policy<br />
in the United States. Suggestive empirical support for our theoretical prediction is also<br />
provided by European evidence. The European Union encompasses large disparities in<br />
the quality of government across regions and member states (Charron, Dijkstra, and Lapuente<br />
2013). Consistent with our model, Fredriksson and Gaston (2000) conclude that<br />
17<br />
18
an EU directive introducing uniform standards for packaging waste “was less stringent<br />
than the existing German, Danish and Dutch laws, but was significantly stricter than<br />
the Greek, Irish and Portuguese requirements.”Italy provides a striking example of large<br />
regional disparities in information and accountability (Putnam 1993; Del Monte and Papagni<br />
2001, 2007; Golden and Picci 2005). Durante, Labartino, and Perotti’s (2011)<br />
empirical findings on decentralization in the Italian public university system correspond<br />
perfectly to our theory. A 1998 reform transferred responsibility for faculty hiring from<br />
the national level to the individual universities. As a result, the quality of academic<br />
recruitment fell in provinces with lower newspaper readership. Those with higher readership<br />
experienced no decline but at most a marginal improvement, implying an aggregate<br />
effi ciency loss from decentralization.<br />
The distributional consequences of centralization are completely inverted if the uniformity<br />
constraint is relaxed. Unconstrained discretional policies favor more politically<br />
influential groups. In our model, political influence stems from information, since more<br />
knowledgeable voters provide more of the politicians’incentives. As a consequence, better<br />
informed regions benefit disproportionately from non-uniform public goods (p ∈ D). This<br />
pattern is consistent with evidence on the regional allocation of discretionary government<br />
spending during the New Deal (Strömberg 2004). Responding to voters’ information,<br />
state governors directed more public funds to counties with a greater share of radio listeners.<br />
Without a uniformity constraint, centralization transfers power from the less to<br />
the more informed regions.<br />
The balance between the two countervailing distributional forces depends on the relative<br />
importance of the two types of public goods. When preferences are homogeneous,<br />
the balance can be summarized by the welfare weight of public goods subject to the<br />
uniformity constraint:<br />
α U ≡ ∑ α p ∈ [0, 1] . (27)<br />
p∈U<br />
Striking the appropriate balance emerges as a crucial requirement of centralization. Its<br />
absence is perilous: the welfare gains described by Proposition 3 are no longer assured<br />
without it. Its presence is beneficial: by modulating the distribution of the accountability<br />
gains between informed and uninformed regions, it can make centralization Pareto<br />
effi cient even in the absence of externalities, despite Proposition 4.<br />
Proposition 5 Suppose that preferences are homogeneous, information is heterogeneous,<br />
and there are no externalities (α l p = α p for all l, θ l ≠ θ m for some l ≠ m, and ξ p = 0 for<br />
all p).<br />
1. There exists a threshold ᾱ U ∈ ( 0, 1 − ρ C) such that centralization yields higher<br />
aggregate welfare than decentralization if and only if α U ≥ ᾱ U .<br />
18<br />
19
2. There exists a threshold ¯σ 2 > 0 such that centralization with an optimal uniformity<br />
constraint Pareto dominates decentralization if α U = 1 − ρ C and σ 2 ≤ ¯σ 2 .<br />
The first result highlights that a uniformity constraint, which creates costs of centralization<br />
in the classic theory of fiscal federalism (Oates 1972), is instead necessary for<br />
the effi ciency of centralization with heterogeneously informed voters. Centralization increases<br />
overall accountability and reduces aggregate rent extraction. When public goods<br />
are uniformly provided by the central government, the resulting increase in productive<br />
public spending benefits the regions who need it most, because their local politicians extract<br />
higher rents under decentralization. Indeed, uniformity induces an egalitarian interregional<br />
allocation, which is precisely what aggregate welfare maximization requires. The<br />
uniformity constraint is not binding for a benevolent central social planner when preferences<br />
are homogeneous.<br />
Instead, all public goods not subject to the uniformity constraint are provided preferentially<br />
to the most informed regions. Their provision is exactly proportional to the level<br />
of information: β C l,p/β C m,p = θ l /θ m for all p ∈ D. The resulting geographic misallocation of<br />
government expenditures can be more ineffi cient than rent extraction. The share of public<br />
goods whose centralized provision is not subject to the uniformity constraint (1 − α U )<br />
measures the share of the central budget that better informed regions can appropriate. In<br />
the limit as α U → 0, uninformed voters certainly suffer more under centralization, when<br />
their taxes are channeled to public spending in better informed regions, than under decentralization,<br />
when they are defrauded by rent-extracting local politicians. The welfare<br />
losses of redistribution across heterogeneously informed voters loom larger than those of<br />
imperfect political agency.<br />
Proposition 5 highlights that the uniformity constraint can mediate between effi ciency<br />
and redistribution. If it can be set optimally at the constitutional table, centralization<br />
may be made Pareto dominant. Better incentives for ruling politicians create an aggregate<br />
surplus that can be shared across regions. For 1 − α U ≥ ρ C , any region with more than<br />
average information (θ l > ¯θ) prefers the budget allocation induced by centralization.<br />
Gaining control of centrally provided goods not subject to the uniformity constraint<br />
(1 − α U ) is worth more than a decrease in rent extraction to ρ D l < ρ C . For ρ C ≥ 1 − α U ,<br />
any region with less than average information (θ l < ¯θ) prefers the budget allocation<br />
induced by centralization. Reducing rent extraction from ρ D l > ρ C is worth more than<br />
the loss of control over distributive goods (1 − α U ). Hence, if 1 − α U = ρ C centralization<br />
induces a Pareto dominant allocation of expenditures.<br />
Beyond the budget allocation, centralization inevitably improves the selection of<br />
politicians in less informed regions, and worsens it in more informed ones. Centralization<br />
can be Pareto effi cient so long as the resulting gains and losses are small, because<br />
politicians’ ability is not too variable (low σ 2 ). Then the main problem in political<br />
19<br />
20
agency is rent extraction (moral hazard) rather than the screening of more skilled politician<br />
(adverse selection). In this case, centralization can always provide a Pareto effi cient<br />
improvement in accountability.<br />
3 Evidence from the Clean Air Act<br />
A clear discontinuity in U.S. environmental policy allows us to test the fundamental<br />
empirical prediction of our model. Up to the 1960s, air pollution had been regulated<br />
primarily by state and local governments. The year 1970 marked a dramatic centralizing<br />
intervention by the federal government. Federal involvement rested on two pillars: the<br />
establishment of the Environmental Protection Agency (EPA), and the passage of the<br />
Clean Air Act of 1970 and subsequent amendments, which phased in national air quality<br />
standards for a set of criterion polluters. National standardization stood in sharp contrast<br />
with the previous state-based regulations, which had been adopted only by a few states,<br />
imposing very heterogenous standards (U.S. Senate, 1970). We use the Clean Air Act,<br />
and the sharp regulatory shift it entailed, to test the distributional predictions of our<br />
model for a uniform nation-wide policy, as derived in Proposition 4.<br />
We consider emissions of sulfur dioxide and nitrogen oxides, two very significant and<br />
harmful pollutants. At relatively high concentrations, NO x and especially SO 2 pollution<br />
has serious adverse health effects. It harms respiratory and cardiovascular functions and<br />
is a cause of premature death. Even at much lower levels, it severely damages crops and<br />
contributes to acid rain. Both SO 2 and NO x were among the pollutants immediately<br />
targeted by the Clean Air Act, starting in 1971. After the National Ambient Air Quality<br />
Standards were imposed, emissions for both sulfur dioxides and nitrogen oxides declined<br />
drastically. While this decline has been extensively studied, the extent of the causal link<br />
between the legislation and the downward trend in emissions is still debated (List and<br />
Gallet 1999; List and Gerking 2000; Greenstone 2002, 2004; List and Sturm 2006; Bulte,<br />
List, and Strazicich 2007; Greenstone, List, and Syverson 2012).<br />
Our empirical investigation focuses on the differential impact of the Clean Air Act<br />
across states. We do not aim at estimating the aggregate effect of the policy shift. Instead,<br />
we test whether the decline in emissions after the federal takeover in 1970 was faster in<br />
states with less informed voters, as predicted by our theory.<br />
The effect of the Clean Air Act on SO 2 and NO x emissions is an appropriate natural<br />
experiment to test the predictions of Proposition 4. The Act introduced uniform<br />
regulation for the entire country, with national air quality standards and a single federal<br />
regulator. At the same time, the consequences of SO 2 and NO x pollution are mostly<br />
localized, in contrast to the case of CO 2 and global warming. Therefore, emissions abatement<br />
generated benefits primarily at the local level, with at most moderate spillovers<br />
across states.<br />
20<br />
21
Hence, our model predicts that until 1970 states with uninformed voters suffered<br />
from bad environmental regulation. They applied ineffective standards, or no standards<br />
whatsoever, because the local government in charge failed to invest money and regulatory<br />
effort on air quality control. The introduction of uniform federal requirements starting<br />
in 1971 should have yielded differential benefits that are monotone decreasing in voter<br />
information. Our testable hypothesis is that the lower the level of information in a state,<br />
the more rapid the decline in pollutant emissions in that state after the enactment of<br />
the Clean Air Act, relative to the pre-1970 baseline. In the robustness analysis, we also<br />
test that this faster reduction in pollution corresponds to an improvement in technique,<br />
rather than a change in the composition or scale of economic activity, whose welfare<br />
consequences would be more ambiguous.<br />
3.1 Empirical Specification<br />
Our econometric analysis consists of a difference-in-differences estimate of the effect of<br />
information on the reduction in emissions following the imposition of national air quality<br />
standards in 1970.<br />
We use a balanced panel of the 48 contiguous United States from 1960 to 1981. We<br />
choose this time horizon because in 1981 Ronald Reagan took offi ce. In the following<br />
years, his environmental policy choices weakened the EPA and curtailed its budget and<br />
staff. Moreover, the Reagan administration championed devolution and a general expansion<br />
of the role of the states. Therefore, developments after 1981 may have entailed a<br />
roll-back of the centralization episode that is the focus of our analysis.<br />
Our baseline regression specification is the following:<br />
p i,t = α + δ t + ζ i + θ i t + d t x ′ iβ + d t x ′ iγ (t − 1970) + ε i,t . (28)<br />
We include year fixed effects δ t , state fixed effects ζ i , and state-specific linear time trends<br />
θ i . We cluster the standard errors ε i,t by state to account for serial correlation of statespecific<br />
shocks. Since spatial correlation is also likely to be present, in our main specification<br />
we allow for two-way clustering by year as well as by state (Cameron, Gelbach, and<br />
Miller 2011). A concern with this specification is that the number of clusters in the time<br />
dimension is relatively small (22 years). Therefore, we also report in the appendix all our<br />
results with one-way clustering by state only. Since the standard errors are very close in<br />
the two cases, we are confident in the validity of two-way clustered standard errors in our<br />
application.<br />
As the first difference, we compare pollution p i,t before the Clean Air Act (d t = 0<br />
from 1960 to 1970) and after its enactment (d t = 1 from 1971 to 1981). The difference<br />
in differences explores differential changes depending on a vector of state characteristics<br />
x i . Both our key explanatory variable and all additional controls are measured taking<br />
21<br />
22
1970 as the reference year. We consider two interactions of the regressors x i . First, the<br />
interaction with the indicator variable d t would capture a level break (β) in the series<br />
upon the introduction of federal emission standards. Second, we add an interaction with<br />
the time elapsed since the creation of the EPA (d t (t − 1970)). This would capture a<br />
break (γ) in the trend of emissions after the reform.<br />
The switch to federal regulation should have an impact on the trend rather than the<br />
level of emissions. The effect of regulatory changes is necessarily gradual because the<br />
object of regulation is durable capital that is only gradually scrapped and replaced. In<br />
fact, the standards introduced by the Clean Air Act and its subsequent amendments<br />
stipulated more stringent regulation on new pollution sources than on pre-existing ones.<br />
Motor vehicles arguably provide the starker example: increasingly strict requirements<br />
were mandated for successive model-years, so over time tighter standards applied to a<br />
steadily growing share of the U.S. vehicle fleet (Kahn 1996). The same pattern holds<br />
for stationary sources: a particularly significant case is differential regulation of old and<br />
newly built power plants, the main source of SO 2 emissions (Nelson, Tietenberg, and<br />
Donihue 1993).<br />
In addition to the technological constraint of natural capital turnover, the implementation<br />
of the Clean Air Act was also somewhat gradual. The National Ambient Air<br />
Quality Standards were defined in 1970, but compliance was expected to be achieved by<br />
1975. The number of operating monitors reading the concentration of air pollutants, a<br />
key factor in enforcement, increased steadily throughout the 1970s (Greenstone, 2004).<br />
3.2 Data<br />
The outcomes of interest are sulfur dioxide and nitrogen oxides emissions. We use the<br />
same data as Bulte, List, Strazicich (2007), who obtained from the EPA panel data on<br />
SO 2 and NO x emissions in the 48 contiguous United States from 1929 to 1999. The<br />
availability of pollution data dictates the level of disaggregation of our analysis. States<br />
are the finest geographic unit for which we have emissions data both before and after<br />
the Clean Air Act. At the county level, pollution data are completely unavailable before<br />
1969; even after the creation of the EPA, emissions were monitored in a very small subset<br />
of countries until the second half of the 1970s. 3<br />
Our preferred measure of pollution is the emission intensity of income, measured in<br />
tons per real dollar. This choice reflects our focus on improvements in technique, and<br />
represents our first step in controlling for a potential reduction in the size of economic<br />
activity due to a tightening of environmental regulation. In Tables 7 and 8 we check<br />
that our results are robust to alternative scalings of the dependent variable, including<br />
3 Sulfur dioxide monitors were initially operating in 16 counties, and the sample did not grow to 100<br />
until 1974.<br />
22<br />
23
emissions per capita and the density of emission per square mile.<br />
We proxy citizens’information with average daily newspaper circulation per capita.<br />
This is a particularly apt measure of voters’ability to acquire information about government<br />
policy. Up to the 1980s, newspapers were Americans’main source of political<br />
news. Moreover, newspaper readers are better informed and more involved in politics<br />
than consumers of other media (Graber 1984; Putnam 1993, 2000; Gentzkow 2006;<br />
Gentzkow, Shapiro, and Sinkinson 2011).<br />
Even in recent years, newspapers remain<br />
an influential source of information on politics and environmental issues.<br />
When they<br />
are subject to greater newspaper coverage, members of Congress more actively support<br />
their constituents’interests (Snyder and Strömberg 2010), and polluting plants reduce<br />
the amount of their toxic emissions (Campa 2013).<br />
We obtain circulation data from<br />
Gentzkow, Shapiro, and Sinkinson’s (2011) dataset. Since their data are only available<br />
for presidential election years, we select as our measure the average of newspaper circulation<br />
per capita in 1968 and 1972.<br />
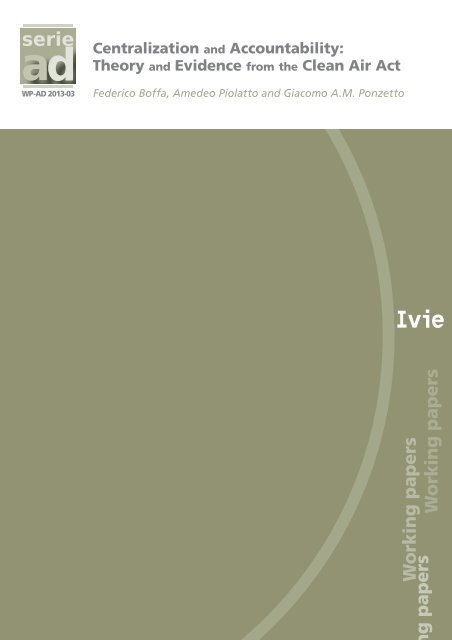
Figure 1 shows the pattern of newspaper circulation per capita across the United<br />
States around 1970. The colors depict four bands whose boundaries are at the cross-state<br />
mean and one standard deviation above and below it. Some geographic clustering of highand<br />
low-information states is apparent. Beyond allowing for arbitrary spatial correlation<br />
of the residuals through our two-way clustering strategy, we also check that the results<br />
are not driven by region-specific common factors. We can focus on the role of information<br />
within each Census Region by adding to the vector of explanatory variables x i a full set<br />
of dummies for the four regions.<br />
Standard economic variables are from the BEA Regional Economic Accounts. We<br />
use average personal income both to construct the dependent variable and as a control<br />
variable. 4 . We use Census population estimates to compute both newspaper circulation<br />
per capita and population density. 5 Moreover, we exploit the decomposition of state value<br />
added by major industry groups (2-digit SIC sector).<br />
Following Greenstone’s (2002) methodology, we categorize a sector as a heavy polluter<br />
on the basis of EPA estimates of its contribution to total emissions by industry as a whole.<br />
This procedure clearly identifies five polluting manufacturing industries: Paper and allied<br />
products (SIC 26), Chemicals and allied products (SIC 28), Petroleum and coal products<br />
(SIC 29), Stone, clay, glass, and concrete (SIC 32), and Primary metal industries (SIC<br />
33). Each of these industry groups accounts for more than 10% of the aggregate industrial<br />
emissions of either of the two pollutants we consider. Instead, every other 2-digit SIC<br />
sector contributes less than 5% of both SO 2 and NO x emissions.<br />
In addition to the share of value added contributed by the sum of these five polluting<br />
4 We transformed amounts originally in current dollars into constant real dollars by using the U.S.<br />
GDP deflator.<br />
5 Land area for each state is taken from the 2000 Census.<br />
23<br />
24
Figure 1 —Information across the United States<br />
Source: Gentzkow, Shapiro, and Sinkinson (2011)<br />
67<br />
25
industries, our controls include the share of manufacturing and the share of Electric, gas,<br />
and sanitary services (SIC 49). The latter is relevant because it includes power generation.<br />
Electric utilities were responsible for almost 56% of anthropogenic SO 2 emissions in the<br />
United States in 1970 (90% of which from coal-fueled power plants), while the entire<br />
industrial sector accounted for 29%– half due to metals processing and the other by the<br />
combustion of high-sulfur fuels in a variety of industrial processes. For NO x emissions, the<br />
contribution of electric utilities was 23%, compared to 20% for industrial fuel combustion.<br />
The single main source of nitrogen oxides was instead on-road vehicles, which accounted<br />
for 35% of the total (but for less than 2% of sulfur dioxide emissions).<br />
Since both SO 2 and NO x are primarily released by the combustion of fossil fuels, we<br />
construct additional control variables using data on state energy consumption provided<br />
by the State Energy Data System (SEDS) database of the Energy Information Administration<br />
(EIA). We compute the fossil-fuel intensity of income as the ratio of aggregate<br />
consumption of all fossil fuels (in Btu) to aggregate personal income (in real dollars).<br />
Additional controls are the shares of coal and of motor gasoline in total fossil-fuel consumption.<br />
The former captures the dominant role of coal combustion in SO 2 emissions,<br />
and the latter the importance of motor vehicles for NO x emissions.<br />
A further set of control variables captures the political environment of each state,<br />
beyond our main focus on voter information. We measure ideology by the average DW-<br />
Nominate score of the state’s two U.S. senators. The score ranks each member of Congress<br />
according to his ideology (left to right), based on legislative roll-call voting behavior (Poole<br />
and Rosenthal, 1985). It proxies for the ideological orientation of the voters the senators<br />
represent.<br />
We consider two measures of partisanship. First, we compute the share of political<br />
offi ces controlled by Republicans in mid-1970. We consider a total of six positions: the<br />
governorship, the two U.S. Senate seats, the majority leaderships in the state senate and<br />
in the state house of representatives, and finally the majority in the state delegation to<br />
the U.S. House of Representatives. We collected data on state legislatures from the Book<br />
of the States, and on all other institutions from Wikipedia.<br />
Our second measure of partisanship is the share of Republican votes in gubernatorial<br />
elections. Gentzkow, Shapiro, and Sinkinson (2011) provide the data for elections that<br />
took place in the presidential years 1968 and 1972. We collected data on gubernatorial<br />
elections from 1969 to 1971 from Wikipedia and the website www.ourcampaigns.com.<br />
Our measure of partisanship around 1970 is the average share of the vote won by the<br />
Republican party in all gubernatorial elections in the state from 1968 to 1972. We use the<br />
same data to construct a standard measure of electoral evenness. For every gubernatorial<br />
election, the index is defined by 1 − |% Republican − 0.5|. Hence, it equals zero if either<br />
party wins 100% of the votes, and one if the two parties are exactly tied. Again, our<br />
overall measure is the average of the indices for all gubernatorial elections in the state<br />
24<br />
26
from 1968 to 1972.<br />
We also control for proximity to the election of the state’s U.S. senators. The U.S.<br />
Senate is divided into three classes of senators serving overlapping six-year terms, so that<br />
a third of the seats are scheduled for re-election every two years. In the period of interest,<br />
Class 2 senators were up for re-election in 1972, Class 3 senators in 1974, and Class 1<br />
senators in 1976. We include among our controls a full set of dummies for the three<br />
possible cases, i.e., senators of Classes 1 and 2, 1 and 3, or 2 and 3. Finally, we include<br />
as a control variable the share of white population (from the U.S. Census), to check for<br />
the possibility of environmental racism.<br />
3.3 Results<br />
Before turning to our regression analysis, we can starkly visualize the main result in<br />
Figure 2.<br />
The graph plots average sulfur dioxide emissions for two group of states:<br />
those with above-average newspaper circulation in 1970, and those with below-average<br />
newspaper circulation. The difference-in-differences emerges clearly: uninformed states<br />
have considerably higher average emissions before 1970, and start decreasing them faster<br />
than the informed states as soon as national emission standards are introduced by the<br />
federal government. The convergence is gradual, but the break in the trend is dramatic.<br />
Table 1 confirms this result in our full regression specification. Column (1), with no<br />
controls, shows a differential break in the trend of SO 2 emissions after 1970, which is<br />
significant at the 10% level. The impact of the Clean Air Act on pollution is a function<br />
of the level of information in each state. As expected, the break in levels is not significant,<br />
but the trends change differently as a consequence of the phasing in of federal air quality<br />
standards. Consistent with our theoretical prediction, the speed of emissions abatement<br />
following the Clean Air Act is inversely proportional to newspaper circulation. If newspaper<br />
circulation in 1970 differed across two states by an amount equal to the standard<br />
deviation of the cross-state distribution (.05 copies per person), the rate of decline of SO 2<br />
emissions in the 1970s compared to the 1960s was higher in the less informed state by<br />
1.7 percentage points per year.<br />
The following columns sequentially add a set of controls. Their inclusion never has a<br />
material impact on our key finding. The point estimate for the coeffi cient on newspaper<br />
circulation is remarkably stable. Moreover, its precision increases as we add controls,<br />
reaching the 5% and even 1% significance threshold. These results strengthen the empirical<br />
support for the prediction of Proposition 4, and indicate that the effect of newspaper<br />
circulation is not due to its correlation with an omitted variable.<br />
Our controls are meant to test for alternative determinants of a heterogeneous impact<br />
of the Clean Air Act on sulfur dioxide abatement across states. The main concern is<br />
that some drivers of differential effects would suggest that the uniform environmental<br />
25<br />
27
Figure 2 —Information and the Impact of the CAA on SO 2 Emissions<br />
Sources: Emissions are from the EPA, newspaper circulation from Gentzkow, Shapiro, and Sinkinson<br />
(2011), and personal income from the BEA Regional Economic Accounts.<br />
68<br />
28
Table 1 —Information and the Effects of the CAA on SO 2 Emissions<br />
Dependent Variable: SO 2 Intensity of Income (log), 1960 to 1981<br />
(1) (2) (3) (4) (5) (6) (7)<br />
Newspaper Circ. -1.641 -0.155 -0.158 -0.092 0.430 -0.102 0.392<br />
× after 1970 (1.095) (0.799) (0.774) (0.836) (1.127) (0.773) (1.100)<br />
Newspaper Circ. 0.319* 0.389* 0.390** 0.424** 0.517** 0.357** 0.431***<br />
× t since 1970 (0.179) (0.192) (0.185) (0.191) (0.211) (0.141) (0.132)<br />
Income (log) -0.767 -0.535 -0.776 -0.337 -0.740 -0.198<br />
× after 1970 (0.587) (0.549) (0.595) (0.640) (0.576) (0.609)<br />
Income (log) -0.099 -0.130 -0.104 -0.018 -0.115 -0.048<br />
× t since 1970 (0.087) (0.091) (0.085) (0.105) (0.069) (0.069)<br />
Pop. Density (log) -0.048 -0.099 -0.046 -0.019 -0.039 -0.053<br />
× after 1970 (0.057) (0.073) (0.056) (0.062) (0.052) (0.059)<br />
Pop. Density (log) 0.010 0.017* 0.012 -0.001 0.005 -0.002<br />
× t since 1970 (0.008) (0.009) (0.007) (0.011) (0.006) (0.007)<br />
Polluting Mfg. % 3.278* 2.108<br />
× after 1970 (1.611) (1.246)<br />
Polluting Mfg. % -0.441 0.056<br />
× t since 1970 (0.261) (0.164)<br />
DW-Nominate 0.066 0.001<br />
× after 1970 (0.190) (0.164)<br />
DW-Nominate 0.036 -0.004<br />
× t since 1970 (0.037) (0.018)<br />
Midwest 0.428** 0.394*<br />
× after 1970 (0.201) (0.195)<br />
Midwest -0.022 0.007<br />
× t since 1970 (0.024) (0.021)<br />
South 0.600** 0.553**<br />
× after 1970 (0.240) (0.215)<br />
South 0.029 0.038<br />
× t since 1970 (0.035) (0.026)<br />
West 0.454 0.410<br />
× after 1970 (0.286) (0.285)<br />
West -0.026 0.002<br />
× t since 1970 (0.044) (0.034)<br />
SO 2 Intensity (log) 0.080 0.032<br />
× after 1970 (0.061) (0.052)<br />
SO 2 Intensity (log) -0.049*** -0.050***<br />
× t since 1970 (0.007) (0.006)<br />
Observations 1056 1056 1056 1056 1056 1056 1056<br />
R 2 0.939 0.941 0.942 0.941 0.943 0.946 0.949<br />
Notes: Robust standard errors in parentheses, with two-way clustering by state and by year; p = 10% * ,<br />
5% ** , 1% *** All regressions include time f.e., state f.e., and state-specific linear time trends. Independent<br />
variables are 1970 values. Polluting Manufacturing % is the share of value added represented by: Paper<br />
and allied products (SIC 26), Chemicals and allied products (SIC 28), Petroleum and coal products (SIC<br />
29), Stone, clay, glass, and concrete (SIC 32), Primary metal industries (SIC 33). The DW-Nominate<br />
score is the average for the state’s U.S. senators.<br />
49<br />
29
egulation imposed by the federal government is ineffi cient or even harmful for some<br />
states. This would be inconsistent with our interpretation of pollution abatement as a<br />
public good.<br />
Column (2) adds the basic controls for income and population density. Controlling<br />
for income addresses concerns related to the environmental Kuznets curve. According to<br />
this line of reasoning, air quality is a luxury good, so poorer states desire a higher level<br />
of pollution (List and Gallet, 1999). The Clean Air Act might then have imposed an<br />
ineffi cient emissions reduction on poor states, compelling them to reduce emissions to a<br />
level suitable only for richer regions. However, the coeffi cient on income is insignificant<br />
and has a negative point estimate, which seems to rule out this interpretation.<br />
Controlling for population density speaks to a similar concern. Since pollution is more<br />
harmful in more densely populated areas, due to its localized adverse health effects, the<br />
Clean Air Act might have suboptimally compelled a greater reduction of emissions in lowdensity<br />
areas. This does not seem to be the case, since there is no significant difference<br />
in differences based on population density– even if the point estimate is positive in this<br />
case, and marginally significant in column (3).<br />
Column (3) also finds some evidence that the introduction of federal regulation had<br />
differential effects depending on the concentration of polluting manufacturing industries.<br />
Surprisingly, the regression suggests that the Clean Air Act immediately induced a greater<br />
decline in pollution in states with a lower GDP share of polluting manufacturing. We<br />
should not overemphasize this result: the coeffi cient becomes insignificant when further<br />
controls are added in column (7). Moreover, it is paired with a large albeit imprecisely<br />
estimated coeffi cient on the trend, so that any differential effect would seem to disappear<br />
before the end of the decade. In any case, the absence of a significant negative coeffi -<br />
cient dispels the concern that the federal regulations might have forced overly stringent<br />
regulations on regions with a specialization in polluting manufacturing industries.<br />
The result also suggests that the effects of the Clean Air Act, and local policy before<br />
its enactment, were not determined primarily by industry lobbying. Under this interpretation,<br />
polluting industries would have pressured state politicians into adopting overly lax<br />
regulations. This alternative scenario would also have implied a faster emissions reduction<br />
after 1970 in states with a greater specialization in polluting manufacturing, albeit<br />
with associated welfare gains. The data, however, do not point to a sharper incidence of<br />
federal regulation on states with a greater concentration of polluting industries. 6<br />
Column (4) introduces ideology. We might be concerned that the states most affected<br />
by federal environmental regulation are those that ideologically oppose it.<br />
We proxy<br />
voters’ ideology with the ideology of their elected representatives, and precisely with<br />
6 Incentives for polluting industries to lobby against environmental regulation have been recently<br />
questioned by Ryan (2012), who shows that incumbent polluters benefit from stricter regulation, which<br />
softens competition by increasing the cost of entry.<br />
26<br />
30
the average DW-Nominate score of each state’s U.S. senators. We find no statistically<br />
discernible effect. This suggests that differences in the impact of the Clean Air Act are<br />
driven by differences in accountability, consistent with our model, rather than in ideology.<br />
Column (5) includes region fixed effects, addressing the concern that the groups of<br />
more and less informed states have an imperfect geographic balance, as seen in Figure 1.<br />
We find that newspaper readership is an even stronger and more significant determinant<br />
of the differential impacts of the Clean Air Act within than across regions.<br />
Column (6) controls for SO 2 intensity in 1970. As expected, this control is highly<br />
significant and hardly affected by the inclusion of additional controls in column (7).<br />
States that started with higher emissions have to reduce them more rapidly as they<br />
converge to a uniform national level of pollution (Kahn 1997). Nonetheless, the effect of<br />
information persists almost unchanged, and is more precisely estimated.<br />
Figure 2 might have suggested that our finding was purely driven by a correlation between<br />
information and the level of pollution before 1970. In fact, the results are stronger<br />
than a mere cross-section for the period before 1970. The difference-in-differences specification<br />
allows us to test for state fixed effects and constant state-specific trends. In<br />
column (6) we also establish that less informed states converge faster to the federal standard<br />
regardless of their initial distance. This combined evidence supports the reading<br />
that newspaper circulation explains not simply 1970 pollution as a whole, but more precisely<br />
a specific ineffi cient component of the emissions level. Consistent with Proposition<br />
4, lower voter information implied greater ineffi ciency of state regulation, and thus a<br />
faster improvement after the switch to federal regulation.<br />
Figure 3 and Table 2 present the results for nitrogen oxides. These are essentially<br />
the same as those for sulfur dioxide. Once again there is a significant, robust and stable<br />
differential break in the emissions trend after 1970 depending on the level of newspaper<br />
circulation. The effect is smaller, though in general more precisely estimated. The point<br />
estimate in column (1) implies that, for two states whose 1970 newspaper circulation<br />
differed by one standard deviation (.05 copies per person), the rate of decline of NO x<br />
emissions in the 1970s compared to the 1960s was higher in the less informed state by<br />
0.9 percentage points per year.<br />
When controls are added in columns (2) to (7), the initial level of emissions is strongly<br />
significant while others are typically insignificant, just as in Table 1. In column (3), all<br />
coeffi cients except the one on information are now statistically indistinguishable from<br />
zero. This strengthens our conclusion that the Clean Air Act did not have differential<br />
effects depending on a state’s specialization in polluting manufacturing industries.<br />
If there is a difference between the patterns of abatement for SO 2 and NO x emissions,<br />
it is that for the latter, once initial pollution is controlled for, population density and<br />
income significantly predict a faster reduction. This difference may plausibly reflect the<br />
fact that motor vehicles are responsible for releasing a large share of NO x (35%) but<br />
27<br />
31
Figure 3 —Information and the Impact of the CAA on NO x Emissions<br />
Sources: Emissions are from the EPA, newspaper circulation from Gentzkow, Shapiro, and Sinkinson<br />
(2011), and personal income from the BEA Regional Economic Accounts.<br />
69<br />
32
Table 2 —Information and the Effects of the CAA on NO x Emissions<br />
Dependent Variable: NO x Intensity of Income (log), 1960 to 1981<br />
(1) (2) (3) (4) (5) (6) (7)<br />
Newspaper Circ. 0.041 0.121 0.120 0.150 0.557 0.165 0.552<br />
× after 1970 (0.256) (0.316) (0.296) (0.335) (0.395) (0.325) (0.392)<br />
Newspaper Circ. 0.160** 0.190** 0.190** 0.187** 0.189* 0.164** 0.157**<br />
× t since 1970 (0.067) (0.082) (0.082) (0.085) (0.097) (0.059) (0.065)<br />
Income (log) 0.020 0.087 0.016 0.055 0.142 0.138<br />
× after 1970 (0.173) (0.177) (0.180) (0.210) (0.183) (0.233)<br />
Income (log) -0.005 -0.006 -0.004 -0.032 -0.078*** -0.081***<br />
× t since 1970 (0.026) (0.028) (0.026) (0.036) (0.022) (0.016)<br />
Pop. Density (log) -0.015 -0.030 -0.014 -0.009 -0.008 -0.013<br />
× after 1970 (0.020) (0.026) (0.020) (0.025) (0.020) (0.032)<br />
Pop. Density (log) -0.003 -0.003 -0.003 0.001 -0.008*** -0.008**<br />
× t since 1970 (0.004) (0.005) (0.004) (0.005) (0.002) (0.003)<br />
Polluting Mfg. % 0.939 0.640<br />
× after 1970 (0.586) (0.454)<br />
Polluting Mfg. % -0.013 0.132<br />
× t since 1970 (0.116) (0.091)<br />
DW-Nominate 0.031 0.004<br />
× after 1970 (0.058) (0.061)<br />
DW-Nominate -0.004 -0.004<br />
× t since 1970 (0.015) (0.011)<br />
Midwest 0.010 -0.007<br />
× after 1970 (0.038) (0.034)<br />
Midwest 0.001 0.016*<br />
× t since 1970 (0.009) (0.008)<br />
South 0.115* 0.084<br />
× after 1970 (0.063) (0.055)<br />
South -0.006 0.014<br />
× t since 1970 (0.014) (0.010)<br />
West 0.105 0.091<br />
× after 1970 (0.067) (0.064)<br />
West 0.013 0.018<br />
× t since 1970 (0.017) (0.014)<br />
NO x Intensity (log) 0.071* 0.042<br />
× after 1970 (0.039) (0.028)<br />
NO x Intensity (log) -0.043*** -0.050***<br />
× t since 1970 (0.011) (0.009)<br />
Observations 1056 1056 1056 1056 1056 1056 1056<br />
R 2 0.973 0.973 0.973 0.973 0.974 0.976 0.976<br />
Notes: Robust standard errors in parentheses, with two-way clustering by state and by year; p = 10% * ,<br />
5% ** , 1% *** All regressions include time f.e., state f.e., and state-specific linear time trends. Independent<br />
variables are 1970 values. Polluting Manufacturing % is the share of value added represented by: Paper<br />
and allied products (SIC 26), Chemicals and allied products (SIC 28), Petroleum and coal products (SIC<br />
29), Stone, clay, glass, and concrete (SIC 32), Primary metal industries (SIC 33). The DW-Nominate<br />
score is the average for the state’s U.S. senators.<br />
50<br />
33
a negligible share of SO 2 (2%). As a result, a substantial fraction of nitrogen oxides<br />
emissions may be abated through policies aimed at individual car owners. Table 2,<br />
columns (6) and (7) suggest that such policies are more effective in richer and more<br />
densely populated states. This pattern hints at the effi ciency of federal regulation, since<br />
richer individuals and urban residents are likely to find it easiest to accelerate the decline<br />
in pollution by replacing their vehicles more rapidly or using them more sparingly. At<br />
the same time, the decline is faster in less informed states, consistent with the view that<br />
they provided lower fruit for the EPA to pick due to the ineffi ciency of their pre-existing<br />
local regulation, as predicted by Proposition 4.<br />
3.4 Robustness<br />
Tables 3 and 4 explore the robustness of our results, respectively for SO 2 and NO x<br />
emissions, to different controls for the industrial structure of each state and for its energy<br />
consumption. Both the point estimates and the significance of the coeffi cient on<br />
newspaper circulation hardly change across specifications.<br />
Column (1) in these tables replicates column (3) of the baseline Tables 1 and 2. Just<br />
as with polluting manufacturing industries, we might be concerned that the Clean Air<br />
Act affected primarily states that specialized in manufacturing as a whole, and that<br />
as a consequence had optimally adopted non-restrictive standards before its passage.<br />
Column (2) finds no evidence of such a pattern, which would imply a significant negative<br />
coeffi cient on the share of manufacturing. Analogously, column (3) shows that there is<br />
no differential effect due to specialization in power generation, the single most polluting<br />
sector (accounting for 56% of SO 2 and 23% of NO x emissions, as opposed to 29% and<br />
20%, respectively, for manufacturing).<br />
Columns (4) to (6) control for total consumption of fossil fuels, relative to income, and<br />
for its breakdown by primary energy source. The main finding is that the Clean Air Act<br />
induced a differentially faster reduction of SO 2 emissions in states with a greater reliance<br />
of coal, and a faster reduction of NO x in states with higher overall fuel consumption.<br />
These results are unsurprising, since combustion of coal is the principal source of sulfur<br />
dioxide, while total consumption of fossil fuels is the main determinant of nitrogen oxides<br />
emissions. As a consequence, there is a tight correspondence between Table 3, column<br />
(5), and Table 1, column (6); and analogously between Table 4, column (4), and Table<br />
1, column (6).<br />
Tables 5 and 6 expand the set of political control beyond the measure of ideology<br />
included in column (4) of the baseline Tables 1 and 2, which is replicated here as column<br />
(1). Our baseline results are again remarkably robust.<br />
Column (2) controls for the share of white population. The concern arising from<br />
environmental justice model is that, absent uniform prescriptive standards, non-whites<br />
28<br />
34
Table 3 —SO 2 Emissions: Alternative Controls for Economic Conditions<br />
Dependent Variable: SO 2 Intensity of Income (log), 1960 to 1981<br />
(1) (2) (3) (4) (5) (6) (7)<br />
Newspaper Circ. -0.158 -0.251 -0.164 -0.073 -0.183 -0.257 -0.264<br />
× after 1970 (0.774) (0.805) (0.835) (0.845) (0.837) (0.827) (0.818)<br />
Newspaper Circ. 0.390** 0.419** 0.389* 0.391* 0.458** 0.447** 0.486**<br />
× t since 1970 (0.185) (0.179) (0.188) (0.190) (0.187) (0.199) (0.186)<br />
Income (log) -0.535 -0.647 -0.756 -0.254 -0.205 -0.785 -0.710<br />
× after 1970 (0.549) (0.620) (0.625) (0.607) (0.605) (0.762) (0.819)<br />
Income (log) -0.130 -0.135 -0.098 -0.089 -0.119 0.073 -0.006<br />
× t since 1970 (0.091) (0.092) (0.079) (0.095) (0.091) (0.121) (0.096)<br />
Density (log) -0.099 -0.087 -0.047 -0.031 -0.045 -0.099 -0.162<br />
× after 1970 (0.073) (0.078) (0.058) (0.051) (0.058) (0.078) (0.105)<br />
Density (log) 0.017* 0.022** 0.011 0.011 0.019** 0.031*** 0.034**<br />
× t since 1970 (0.009) (0.010) (0.008) (0.007) (0.007) (0.011) (0.016)<br />
Polluting Mfg. % 3.278* 1.598<br />
× after 1970 (1.611) (1.559)<br />
Polluting Mfg. % -0.441 -0.230<br />
× t since 1970 (0.261) (0.277)<br />
Manufacturing % 0.719 0.571<br />
× after 1970 (0.728) (0.785)<br />
Manufacturing % -0.217 0.024<br />
× t since 1970 (0.139) (0.162)<br />
Utilities % 0.952 -8.200<br />
× after 1970 (9.497) (10.469)<br />
Utilities % 0.057 -0.216<br />
× t since 1970 (1.957) (1.985)<br />
Fossil Fuels (log) 0.375** 0.321** -0.200 -0.229<br />
× after 1970 (0.153) (0.135) (0.329) (0.414)<br />
Fossil Fuels (log) 0.007 0.040 0.183* 0.162*<br />
× t since 1970 (0.036) (0.029) (0.089) (0.083)<br />
Coal % 0.354 -0.004<br />
× after 1970 (0.320) (0.275)<br />
Coal % -0.215*** -0.181**<br />
× t since 1970 (0.043) (0.074)<br />
Motor Gas. % -3.280 -3.332<br />
× after 1970 (1.982) (2.320)<br />
Motor Gas. % 1.000* 0.660<br />
× t since 1970 (0.547) (0.547)<br />
Observations 1056 1056 1056 1056 1056 1056 1056<br />
R 2 0.942 0.941 0.940 0.942 0.944 0.943 0.945<br />
Notes: Robust standard errors in parentheses, with two-way clustering by state and by year; p =<br />
10% * , 5% ** , 1% *** All regressions include time f.e., state f.e., and state-specific linear time trends. All<br />
independent variables are 1970 values. Manufacturing %, Polluting Manufacturing %, and Utilities %<br />
are shares of state GDP. Polluting manufacturing industries are: Paper and allied products (SIC 26),<br />
Chemicals and allied products (SIC 28), Petroleum and coal products (SIC 29), Stone, clay, glass, and<br />
concrete (SIC 32), Primary metal industries (SIC 33). Fossil Fuels is the log of consumption relative to<br />
income. Coal % and Motor Gasoline % are shares of fossil-fuel consumption.<br />
51<br />
35
Table 4 —NO x Emissions: Alternative Controls for Economic Conditions<br />
Dependent Variable: NO x Intensity of Income (log), 1960 to 1981<br />
(1) (2) (3) (4) (5) (6) (7)<br />
Newspaper Circ. 0.120 0.102 0.163 0.139 0.130 0.161 0.237<br />
× after 1970 (0.296) (0.300) (0.314) (0.319) (0.324) (0.326) (0.311)<br />
Newspaper Circ. 0.190** 0.189** 0.189** 0.182*** 0.187** 0.176** 0.182**<br />
× t since 1970 (0.082) (0.081) (0.079) (0.063) (0.069) (0.067) (0.067)<br />
Income (log) 0.087 0.044 -0.033 0.138 0.142 0.201 0.136<br />
× after 1970 (0.177) (0.179) (0.165) (0.195) (0.199) (0.204) (0.185)<br />
Income (log) -0.006 -0.003 -0.003 -0.056* -0.058* -0.073 -0.088**<br />
× t since 1970 (0.028) (0.027) (0.023) (0.029) (0.029) (0.046) (0.039)<br />
Density (log) -0.030 -0.023 -0.018 -0.011 -0.012 -0.003 -0.026<br />
× after 1970 (0.026) (0.025) (0.019) (0.019) (0.020) (0.023) (0.029)<br />
Density (log) -0.003 -0.004 -0.003 -0.005* -0.004 -0.007 -0.009*<br />
× t since 1970 (0.005) (0.004) (0.004) (0.002) (0.003) (0.005) (0.005)<br />
Polluting Mfg. % 0.939 0.961<br />
× after 1970 (0.586) (0.604)<br />
Polluting Mfg. % -0.013 0.284**<br />
× t since 1970 (0.116) (0.128)<br />
Manufacturing % 0.140 0.020<br />
× after 1970 (0.213) (0.205)<br />
Manufacturing % 0.009 -0.054<br />
× t since 1970 (0.047) (0.047)<br />
Utilities % -4.499 -7.437*<br />
× after 1970 (3.117) (3.815)<br />
Utilities % 0.146 0.606<br />
× t since 1970 (0.664) (0.387)<br />
Fossil Fuels (log) 0.086* 0.082* 0.154 0.126<br />
× after 1970 (0.050) (0.045) (0.117) (0.126)<br />
Fossil Fuels (log) -0.038** -0.035** -0.056 -0.075**<br />
× t since 1970 (0.014) (0.014) (0.040) (0.035)<br />
Coal % 0.029 -0.066<br />
× after 1970 (0.084) (0.083)<br />
Coal % -0.015 -0.032<br />
× t since 1970 (0.018) (0.022)<br />
Motor Gas. % 0.386 0.218<br />
× after 1970 (0.577) (0.660)<br />
Motor Gas. % -0.104 -0.146<br />
× t since 1970 (0.190) (0.171)<br />
Observations 1056 1056 1056 1056 1056 1056 1056<br />
R 2 0.973 0.973 0.973 0.975 0.975 0.975 0.976<br />
Notes: Robust standard errors in parentheses, with two-way clustering by state and by year; p =<br />
10% * , 5% ** , 1% *** All regressions include time f.e., state f.e., and state-specific linear time trends. All<br />
independent variables are 1970 values. Manufacturing %, Polluting Manufacturing %, and Utilities %<br />
are shares of state GDP. Polluting manufacturing industries are: Paper and allied products (SIC 26),<br />
Chemicals and allied products (SIC 28), Petroleum and coal products (SIC 29), Stone, clay, glass, and<br />
concrete (SIC 32), Primary metal industries (SIC 33). Fossil Fuels is the log of consumption relative to<br />
income. Coal % and Motor Gasoline % are shares of fossil-fuel consumption.<br />
52<br />
36
Table 5 —SO 2 Emissions: Alternative Controls for Political Conditions<br />
Dependent Variable: SO 2 Intensity of Income (log), 1960 to 1981<br />
(1) (2) (3) (4) (5) (6) (7)<br />
Newspaper Circ. -0.092 1.707* -0.132 0.320 0.272 -0.206 1.678<br />
× after 1970 (0.836) (0.966) (0.783) (0.750) (0.780) (0.848) (1.221)<br />
Newspaper Circ. 0.424** 0.484** 0.397* 0.375* 0.421* 0.381* 0.513**<br />
× t since 1970 (0.191) (0.228) (0.197) (0.203) (0.205) (0.185) (0.235)<br />
Income (log) -0.776 -0.188 -0.727 -0.502 -0.641 -0.830 -0.452<br />
× after 1970 (0.595) (0.509) (0.751) (0.629) (0.607) (0.591) (0.611)<br />
Income (log) -0.104 -0.069 -0.085 -0.106 -0.089 -0.068 -0.064<br />
× t since 1970 (0.085) (0.098) (0.085) (0.094) (0.092) (0.093) (0.103)<br />
Density (log) -0.046 -0.136** -0.052 -0.062 -0.057 -0.047 -0.140**<br />
× after 1970 (0.056) (0.065) (0.054) (0.057) (0.057) (0.055) (0.065)<br />
Density (log) 0.012 0.006 0.009 0.011 0.010 0.011 0.008<br />
× t since 1970 (0.007) (0.010) (0.008) (0.007) (0.008) (0.008) (0.009)<br />
DW-Nominate 0.066 -0.311<br />
× after 1970 (0.190) (0.206)<br />
DW-Nominate 0.036 0.048<br />
× t since 1970 (0.037) (0.042)<br />
White Pop. % -2.741*** -3.789**<br />
× after 1970 (0.948) (1.418)<br />
White Pop. % -0.139 -0.065<br />
× t since 1970 (0.156) (0.180)<br />
% R. in Offi ce -0.038 0.416<br />
× after 1970 (0.253) (0.262)<br />
% R. in Offi ce -0.013 -0.041*<br />
× t since 1970 (0.022) (0.024)<br />
% R. Votes -0.749* -0.434<br />
× after 1970 (0.379) (0.544)<br />
% R. Votes 0.022 0.294**<br />
× t since 1970 (0.102) (0.135)<br />
Elect. Evenness -0.586 0.721<br />
× after 1970 (0.357) (0.475)<br />
Elect. Evenness -0.043 -0.290<br />
× t since 1970 (0.130) (0.173)<br />
Sen. Class 1+3 0.047 -0.041<br />
× after 1970 (0.130) (0.100)<br />
Sen. Class 1+3 0.006 0.012<br />
× t since 1970 (0.019) (0.021)<br />
Sen. Class 2+3 -0.009 -0.126<br />
× after 1970 (0.101) (0.118)<br />
Sen. Class 2+3 0.034 0.036<br />
× t since 1970 (0.023) (0.023)<br />
Observations 1056 1056 1056 1056 1056 1056 1056<br />
R 2 0.941 0.943 0.941 0.941 0.942 0.941 0.945<br />
Notes: Robust standard errors in parentheses, with two-way clustering by state and by year; p =<br />
10% * , 5% ** , 1% *** All regressions include time f.e., state f.e., and state-specific linear time trends.<br />
All independent variables are 1970 values. The DW-Nominate score is the average for the state’s U.S.<br />
senators. The share of Republicans in offi ce is computed considering the governor, the leaders of the two<br />
state legislatures, the two U.S. senators, and the majority of the state delegation to the U.S. House of<br />
Representatives. The share of Republican votes is the average in gubernatorial elections from 1968 to<br />
1972. Election evenness is the average of 1− |% R. Votes −0.5| in gubernatorial elections from 1968 to<br />
1972.<br />
53<br />
37
Table 6 —NO x Emissions: Alternative Controls for Political Conditions<br />
Dependent Variable: NO x Intensity of Income (log), 1960 to 1981<br />
(1) (2) (3) (4) (5) (6) (7)<br />
Newspaper Circ. 0.150 0.427 0.188 0.235 0.273 0.111 0.478<br />
× after 1970 (0.335) (0.321) (0.296) (0.294) (0.290) (0.339) (0.361)<br />
Newspaper Circ. 0.187** 0.188* 0.192** 0.217** 0.204** 0.173** 0.152<br />
× t since 1970 (0.085) (0.099) (0.082) (0.091) (0.086) (0.072) (0.089)<br />
Income (log) 0.016 0.115 0.138 0.084 0.065 -0.006 0.156<br />
× after 1970 (0.180) (0.192) (0.195) (0.218) (0.192) (0.171) (0.220)<br />
Income (log) -0.004 -0.006 -0.002 0.010 -0.001 -0.017 -0.003<br />
× t since 1970 (0.026) (0.026) (0.027) (0.020) (0.030) (0.025) (0.020)<br />
Density (log) -0.014 -0.030 -0.026 -0.018 -0.018 -0.015 -0.030<br />
× after 1970 (0.020) (0.024) (0.021) (0.021) (0.020) (0.019) (0.023)<br />
Density (log) -0.003 -0.003 -0.003 -0.004 -0.003 -0.003 -0.002<br />
× t since 1970 (0.004) (0.004) (0.004) (0.003) (0.004) (0.004) (0.004)<br />
DW-Nominate 0.031 0.118*<br />
× after 1970 (0.058) (0.068)<br />
DW-Nominate -0.004 0.000<br />
× t since 1970 (0.015) (0.018)<br />
White Pop. % -0.451 -0.136<br />
× after 1970 (0.267) (0.247)<br />
White Pop. % 0.004 0.047<br />
× t since 1970 (0.048) (0.060)<br />
% R. in Offi ce -0.112 -0.140<br />
× after 1970 (0.069) (0.084)<br />
% R. in Offi ce -0.003 -0.004<br />
× t since 1970 (0.011) (0.013)<br />
% R. Votes -0.181 0.108<br />
× after 1970 (0.151) (0.160)<br />
% R. Votes -0.043 -0.099<br />
× t since 1970 (0.040) (0.091)<br />
Elect. Evenness -0.210 -0.200<br />
× after 1970 (0.134) (0.130)<br />
Elect. Evenness -0.019 0.078<br />
× t since 1970 (0.040) (0.105)<br />
Sen. Class 1+3 0.009 0.009<br />
× after 1970 (0.035) (0.032)<br />
Sen. Class 1+3 0.015* 0.013<br />
× t since 1970 (0.008) (0.008)<br />
Sen. Class 2+3 -0.015 -0.016<br />
× after 1970 (0.024) (0.026)<br />
Sen. Class 2+3 0.004 0.004<br />
× t since 1970 (0.009) (0.009)<br />
Observations 1056 1056 1056 1056 1056 1056 1056<br />
R 2 0.973 0.973 0.973 0.973 0.973 0.973 0.974<br />
Notes: Robust standard errors in parentheses, with two-way clustering by state and by year; p =<br />
10% * , 5% ** , 1% *** All regressions include time f.e., state f.e., and state-specific linear time trends.<br />
All independent variables are 1970 values. The DW-Nominate score is the average for the state’s U.S.<br />
senators. The share of Republicans in offi ce is computed considering the governor, the leaders of the two<br />
state legislatures, the two U.S. senators, and the majority of the state delegation to the U.S. House of<br />
Representatives. The share of Republican votes is the average in gubernatorial elections from 1968 to<br />
1972. Election evenness is the average of 1− |% R. Votes −0.5| in gubernatorial elections from 1968 to<br />
1972.<br />
54<br />
38
face disproportionately more pollution due to their lower political clout. If so, the Clean<br />
Air Act should disproportionately reduce emissions in states with a lower percentage of<br />
white residents. We find instead that SO 2 emissions declined more rapidly after 1970<br />
in states with a higher share of white population, while there is no differential effect for<br />
nitrogen oxides. The result is in line with Gray and Shadbegian’s findings (2004). They<br />
study air and water pollution for 409 U.S. pulp and paper mills between 1985 and 1997,<br />
and conclude that pollution is in fact lower in minority areas.<br />
Columns (3) and (4) control for partisanship, with the same rationale we discussed for<br />
ideology. We check if the impact of the Clean Air Act varies across states depending on<br />
their political leanings. Overall, we find no evidence that the EPA had a disproportionate<br />
impact in more Republican states, whether measured by vote shares in the gubernatorial<br />
election or by the number of state-wide elections won by the Republican party. All<br />
coeffi cients are insignificant for nitrogen oxides in Table 6. For sulfur dioxide, Table 5<br />
finds conflicting results within column (7) as well as across columns (4) and (7). In<br />
any case, a measure of partisanship seems less appropriate than our baseline measure of<br />
ideology. First, we should not overlook that the creation of the EPA was proposed by<br />
a Republican president, Richard Nixon. Second, party affi liation around 1970 masked<br />
substantial ideological differences between the very conservative Southern Democrats,<br />
and the more liberal Democrats in the rest of the country.<br />
Column (5) controls for a differential effect on states whose elections are more evenly<br />
split between the two parties. The absence of a significant effect is consistent with our<br />
theoretical model, in which the margin of victory in the election is determined by random<br />
shocks rather than by the underlying level of political accountability.<br />
Column (6) considers the proximity of U.S. Senate elections. Table 6 finds that the<br />
decline in NO x emissions is slower in states whose U.S. senators are furthest from reelection<br />
in 1971, i.e., who belong to Classes 1 and 3. This finding might suggest that<br />
federally mandated pollution abatement is popular with voters. However, we should not<br />
read too much into a coeffi cient that is not robust to the inclusion of additional controls<br />
in column (7), and whose significance is limited to one of the pollutants for no discernible<br />
economic reason.<br />
Finally, Tables 7 and 8 consider alternative dependent variables. For each we report<br />
two regressions: one controlling for income and population density alone, the other<br />
including all the controls from our baseline Tables 1 and 2.<br />
Our preferred measure of pollution is the emissions intensity of income, which has the<br />
advantage of capturing the environmental effi ciency of production, and inherently controlling<br />
for the potential displacement of economic activity. However, measuring emissions<br />
per capita or emissions density over space may provide a more accurate estimate<br />
of the adverse environmental and health consequences of pollution, which depend on the<br />
concentration of pollutants and the number of people exposed to them. In every case<br />
29<br />
39
Table 7 —SO 2 Emissions: Alternative Dependent Variables<br />
SO 2 /cap. SO 2 /cap. SO 2 /sq.m. SO 2 /sq.m. SO 2 /$ SO 2 /$<br />
Income (log) at t -0.720* -0.690**<br />
(0.416) (0.328)<br />
Pop. Den. (log) at t -0.820 -0.525<br />
(1.132) (1.270)<br />
Newspaper Circ. -0.096 0.352 -0.048 0.402 -0.073 0.391<br />
× after 1970 (0.741) (1.055) (0.729) (1.039) (0.750) (1.066)<br />
Newspaper Circ. 0.392* 0.443*** 0.374* 0.449*** 0.377* 0.442***<br />
× t since 1970 (0.194) (0.144) (0.200) (0.156) (0.196) (0.150)<br />
Income (log) -0.834 -0.221 -0.884 -0.294 -0.856 -0.252<br />
× after 1970 (0.580) (0.579) (0.568) (0.558) (0.578) (0.565)<br />
Income (log) -0.076 -0.035 -0.099 -0.066 -0.101 -0.055<br />
× t since 1970 (0.090) (0.072) (0.094) (0.078) (0.103) (0.096)<br />
Pop. Density (log) -0.066 -0.074 -0.062 -0.066 -0.058 -0.063<br />
× after 1970 (0.056) (0.057) (0.054) (0.053) (0.054) (0.053)<br />
Pop. Density (log) 0.007 -0.004 0.002 -0.009 0.004 -0.006<br />
× t since 1970 (0.008) (0.008) (0.009) (0.009) (0.009) (0.007)<br />
Polluting Mfg. % 1.948 1.901 1.973<br />
× after 1970 (1.245) (1.219) (1.234)<br />
Polluting Mfg. % 0.108 0.122 0.099<br />
× t since 1970 (0.179) (0.177) (0.173)<br />
DW-Nominate 0.015 0.049 0.028<br />
× after 1970 (0.158) (0.156) (0.160)<br />
DW-Nominate -0.006 -0.004 -0.004<br />
× t since 1970 (0.017) (0.018) (0.018)<br />
Midwest 0.415* 0.414** 0.408*<br />
× after 1970 (0.200) (0.198) (0.198)<br />
Midwest 0.006 0.001 0.004<br />
× t since 1970 (0.023) (0.024) (0.022)<br />
South 0.559** 0.547** 0.551**<br />
× after 1970 (0.210) (0.208) (0.209)<br />
South 0.038 0.035 0.037<br />
× t since 1970 (0.027) (0.027) (0.026)<br />
West 0.383 0.380 0.390<br />
× after 1970 (0.274) (0.268) (0.274)<br />
West 0.009 0.012 0.008<br />
× t since 1970 (0.034) (0.035) (0.035)<br />
SO 2 Intensity (log) 0.036 0.037 0.035<br />
× after 1970 (0.051) (0.049) (0.051)<br />
SO 2 Intensity (log) -0.050*** -0.050*** -0.050***<br />
× t since 1970 (0.006) (0.006) (0.006)<br />
Observations 1056 1056 1056 1056 1056 1056<br />
R 2 0.936 0.945 0.974 0.977 0.941 0.949<br />
Notes: Robust standard errors in parentheses, with two-way clustering by state and by year; p =<br />
10% * , 5% ** , 1% *** All regressions include time f.e., state f.e., and state-specific linear time trends.<br />
Dependent variables are logarithms. Independent variables interacted with the 1970 break are 1970<br />
values. Polluting Manufacturing % is the share of value added represented by: Paper and allied products<br />
(SIC 26), Chemicals and allied products (SIC 28), Petroleum and coal products (SIC 29), Stone, clay,<br />
glass, and concrete (SIC 32), Primary metal industries (SIC 33). The DW-Nominate score is the average<br />
for the state’s U.S. senators.<br />
55<br />
40
Table 8 —NO x Emissions: Alternative Dependent Variables<br />
NO x /cap. NO x /cap. NO x /sq.m. NO x /sq.m. NO x /$ NO x /$<br />
Income (log) at t -1.101*** -1.007***<br />
(0.160) (0.166)<br />
Pop. Den. (log) at t -1.031*** -0.933***<br />
(0.313) (0.324)<br />
Newspaper Circ. 0.179 0.497 0.227 0.536 0.235 0.533<br />
× after 1970 (0.236) (0.350) (0.234) (0.336) (0.230) (0.334)<br />
Newspaper Circ. 0.193*** 0.179*** 0.175*** 0.189*** 0.175*** 0.188***<br />
× t since 1970 (0.066) (0.058) (0.053) (0.054) (0.049) (0.055)<br />
Income (log) -0.047 0.105 -0.097 0.020 -0.105 0.025<br />
× after 1970 (0.151) (0.197) (0.129) (0.166) (0.124) (0.168)<br />
Income (log) 0.017 -0.054*** -0.006 -0.077*** -0.004 -0.075***<br />
× t since 1970 (0.020) (0.018) (0.013) (0.020) (0.018) (0.019)<br />
Pop. Density (log) -0.033 -0.037 -0.029 -0.032 -0.031 -0.032<br />
× after 1970 (0.020) (0.031) (0.017) (0.027) (0.018) (0.028)<br />
Pop. Density (log) -0.006* -0.008** -0.012*** -0.011*** -0.012*** -0.011***<br />
× t since 1970 (0.003) (0.003) (0.003) (0.004) (0.003) (0.004)<br />
Polluting Mfg. % 0.547 0.549 0.548<br />
× after 1970 (0.464) (0.473) (0.477)<br />
Polluting Mfg. % 0.142 0.137 0.137<br />
× t since 1970 (0.105) (0.106) (0.106)<br />
DW-Nominate 0.016 0.049 0.047<br />
× after 1970 (0.052) (0.047) (0.046)<br />
DW-Nominate -0.006 -0.003 -0.003<br />
× t since 1970 (0.010) (0.010) (0.010)<br />
Midwest 0.019 0.022 0.022<br />
× after 1970 (0.034) (0.032) (0.031)<br />
Midwest 0.011 0.003 0.004<br />
× t since 1970 (0.008) (0.008) (0.007)<br />
South 0.094* 0.087 0.088<br />
× after 1970 (0.051) (0.052) (0.052)<br />
South 0.008 0.003 0.003<br />
× t since 1970 (0.009) (0.010) (0.009)<br />
West 0.067 0.066 0.066<br />
× after 1970 (0.055) (0.050) (0.052)<br />
West 0.024* 0.026* 0.026*<br />
× t since 1970 (0.013) (0.013) (0.014)<br />
NO x Intensity (log) 0.033* 0.020 0.020<br />
× after 1970 (0.019) (0.014) (0.019)<br />
NO x Intensity (log) -0.036*** -0.028** -0.028**<br />
× t since 1970 (0.010) (0.010) (0.013)<br />
Observations 1056 1056 1056 1056 1056 1056<br />
R 2 0.971 0.973 0.995 0.996 0.977 0.979<br />
Notes: Robust standard errors in parentheses, with two-way clustering by state and by year; p =<br />
10% * , 5% ** , 1% *** All regressions include time f.e., state f.e., and state-specific linear time trends.<br />
Dependent variables are logarithms. Independent variables interacted with the 1970 break are 1970<br />
values. Polluting Manufacturing % is the share of value added represented by: Paper and allied products<br />
(SIC 26), Chemicals and allied products (SIC 28), Petroleum and coal products (SIC 29), Stone, clay,<br />
glass, and concrete (SIC 32), Primary metal industries (SIC 33). The DW-Nominate score is the average<br />
for the state’s U.S. senators.<br />
56<br />
41
our baseline results are fully confirmed. For nitrogen oxides, the estimates become, if<br />
anything, more precise.<br />
In the last two columns we consider a fully general specification that leaves emission<br />
intensity of income on the left-hand side, but adds contemporaneous controls for income<br />
and population density to the right-hand side:<br />
log P i,t<br />
Y i,t<br />
= κ log Y i,t<br />
L i,t<br />
+ λ log L i,t<br />
T i<br />
+ α + δ t + ζ i + θ i t + d t x ′ iβ + d t x ′ iγ (t − 1970) + ε i,t , (29)<br />
where P i,t denotes tons of polluting emissions, Y i,t aggregate personal income in real<br />
dollars, L i,t population and T i land area. This specification has the appeal of nesting<br />
all the alternative we previously considered, but the drawback of including potentially<br />
endogenous time-varying regressors. The robustness of our baseline results is confirmed<br />
yet again.<br />
Moreover, we find suggestive evidence of an environmental Kuznets curve. The emissions<br />
intensity of income declines when income rises. In addition, nitrogen oxides are<br />
significantly lower in more densely populated states, suggesting that urban areas record<br />
lower emissions per unit of income with respect to rural areas, possibly as a result of the<br />
lower incidence of driving.<br />
3.5 Discussion<br />
Overall, our empirical evidence provides robust support for the theoretical prediction<br />
that the Clean Air Act induced a faster decline of pollution in states with lower newspaper<br />
circulation. This pattern can be plausibly interpreted according to the model of<br />
Section 2. The differential emissions abatement represents the welfare gains that the<br />
uninformed reap from centralization. Federal intervention solves a regulatory failure in<br />
states with low newspaper readership, whose local governments failed to invest effi ciently<br />
in environmental regulation.<br />
Suggestive evidence of such a regulatory failure in uninformed states can be gleaned<br />
from direct measures of local government activity. We look at two different regulatory<br />
inputs: expenditures by state and local governments for air quality control, and actual<br />
regulations implemented by states and local governments before 1970.<br />
We obtain expenditure data from the U.S. Department of Commerce yearly report:<br />
“Environmental Quality Control” (U.S. Bureau of the Census 1971, 1980). The report<br />
publishes the yearly expenditure for air quality control by states, counties, and cities.<br />
Since the first published report is for the fiscal year 1969, this source allows a rough<br />
comparison between one year before the 1970 Clean Air Act to one after: we consider<br />
a decade and compare data for the fiscal year 1969 and 1978. By combining state,<br />
county and city data, we construct a measure total expenditure for air quality control<br />
30<br />
42
egulation for each year and state. Splitting the sample into two groups of states, based<br />
on average newspaper circulation in 1970, we find that in 1969 spending relative to<br />
GDP in uninformed states was on average 71% as much as in informed states. In 1978,<br />
spending in uninformed states rose to 86% of spending in informed states.<br />
After the<br />
introduction of uniform standards, uninformed states closed half the gap with informed<br />
states. Hence, the 1970 policy shift may have fostered convergence of state and local<br />
government expenditures in air pollution regulation, with less informed states gradually<br />
catching up to more informed ones.<br />
Our second measure of regulatory input is the total number of standards implemented<br />
at the state level before 1970.<br />
Our source are the hearings of the subcommittee on<br />
air and water pollution of the U.S. Senate (U.S. Senate, 1970). The document reports<br />
the standards adopted by states and local governments before 1970 on ten pollutants. 7<br />
Counting the number of pollutants that each state had regulated prior to 1970, we find<br />
that states with above-average newspaper circulation had adopted four standards on<br />
average, while uninformed states had adopted three standards only. The hearings also<br />
report the number of states that had proposed or adopted emission standards for sulfur<br />
dioxide and for total suspended particulate as a result of the provision of the 1967 Air<br />
Quality Act. 8 50% of the states with high newspaper circulation had proposed or adopted<br />
emission standards for the two pollutants, as opposed to only 25% of the states with low<br />
newspaper circulation. This suggests that informed states were putting more effort in<br />
the development of air quality standards, while uninformed states were in greater need<br />
of federal intervention.<br />
The benefits associated with environmental regulation are large and well documented.<br />
Chay and Greenstone (2005) estimate the hedonic value of the improvements in air quality<br />
induced by the Clean Air Act through their impact on housing prices. By using data on<br />
total suspended particulates, they find that better air quality caused a substantial increase<br />
in house prices, which amounted in the aggregate to $45 billion (in 2001 dollars). Bayer,<br />
Kehoane and Timmins (2009) provide much larger estimates of the benefits of emissions<br />
abatement. They model explicitly households’location choice, recognizing the costs of<br />
moving.<br />
Considering U.S. metropolitan areas in the 1990s, they estimate a marginal<br />
willingness to pay for a better air quality that is as much as seven times as large as<br />
Chay and Greenstone’s (2005) estimate. Luechinger (2009) behavioral economics analysis<br />
also suggests that Chay and Greenstone’s (2005) estimates are conservative. Comparing<br />
self-reported survey perceptions of life satisfaction and house prices in Germany from<br />
7 The ten pollutants are carbon monoxides, beryllium, fluorides, hydrogen sulfide, lead, nitrogen oxides,<br />
sulfur dioxides, sulfuric acid, suspended particulates and total oxidants.<br />
8 The 1967 Air Quality Act required that states establish air quality control regions and that the<br />
Department of Health, Education, and Welfare promulgate criteria to serve as the basis for setting<br />
emission standards. States would then use the HEW information to set air quality standards. Under the<br />
Air Quality Act, states retained autonomy in their decision of setting the criteria.<br />
31<br />
43
1985 to 2003, he estimates that only 16% of the total willingness to pay for clean air is<br />
capitalized in the housing market. Finally, air pollution is shown to be positivelly related<br />
to infant mortality. Chay and Greenstone (2003) estimate that a reduction in suspended<br />
particulates by 1 µg/m 3 is associated to approximately 200 additional infants per year<br />
surviving to one year of age in the United States. Currie and Schmieder (2009) show that<br />
the abatement of toluene, cadmium and lead emissions that occurred in the late 1980s<br />
and 1990s has determined a reduction of more than 220 infants deaths in 2000.<br />
On the other hand, a legitimate concern is that clean air may come at the cost of<br />
a deterioration in local economic conditions. Plants may choose to relocate away from<br />
tightly regulated areas, implying an ineffi ciency at least for a subset of states. At the<br />
local level, air quality regulation does affect industrial location and causes reductions in<br />
employment, investment and shipments (Henderson 1996; Becker and Henderson 2000).<br />
Tight environmental standards affect most sharply heavily polluting industries, which<br />
experience a reduction in employment, output, capital stock, and total factor productivity<br />
(Greenstone, 2002; Greenstone, List and Syverson, 2012).<br />
Our finding that the differential effects of the Clean Air Act are not determined by<br />
industrial composition suggests a limited role for displacement. We test for displacement<br />
more directly by examining differences in differences for outcomes related to economic<br />
activity and industrial composition. In Table 9 we run the difference-in-differences specification<br />
from equation 28, replacing emissions on the left-hand side with eight variables<br />
that may have been affected, directly or indirectly, by abatement efforts mandated by the<br />
Clean Air Act. On the right-hand side, in addition to newspaper circulation, we include<br />
our fundamental controls: income and population density.<br />
Most important, we find no significant differential effect of information on income<br />
or population density after 1970. Figures 4 and 5 depict the result graphically. After<br />
the passage of the Clean Air Act, states with lower newspaper circulation experienced<br />
a faster reduction in pollution, but neither slower income growth nor slower population<br />
growth. This finding lends support to the view that federal intervention helped the<br />
uninformed without harming them, neither by reducing their income in the short run,<br />
nor by reducing the appeal of the state and inducing outmigration in the longer run.<br />
The differential reduction in pollution was derived without any impact on the scale of<br />
economic activity.<br />
There is some evidence that more informed states had a slower decline in the share<br />
of polluting manufacturing industries after 1970. This suggests that at least some displacement<br />
may have occurred, although Figure 6 raises the suspicion that the pattern<br />
may be driven by differential trends in the early 1960s. This could be the reason why<br />
the significant coeffi cient is on a break in the level of the series, rather than on its trend,<br />
where it would be expected due to the gradual phase-in of environmental regulation. 9 In<br />
9 Moreover, the statistical significance of this coeffi cient uniquely depends on the choice of two-way or<br />
32<br />
44
Table 9 —Channels of Pollution Abatement<br />
Income Pop. Den. Poll. % Mfg. % Util. % F. Fuel Coal % Gas. %<br />
Newspaper Circ. 0.059 0.048 0.020* 0.022 0.011 -0.147 0.223 -0.017<br />
× after 1970 (0.172) (0.037) (0.010) (0.034) (0.007) (0.274) (0.150) (0.036)<br />
Newspaper Circ. 0.002 -0.018 0.000 -0.009 0.001 0.097* 0.041 -0.013<br />
× t since 1970 (0.025) (0.024) (0.005) (0.009) (0.002) (0.052) (0.025) (0.008)<br />
Income (log) -0.067 -0.050* -0.009 -0.018 0.003 0.216 -0.031 -0.035<br />
× after 1970 (0.058) (0.028) (0.006) (0.010) (0.003) (0.175) (0.093) (0.029)<br />
Income (log) 0.022** -0.023** 0.001 0.012*** -0.000 -0.008 0.001 0.003<br />
× t since 1970 (0.010) (0.010) (0.002) (0.004) (0.001) (0.019) (0.013) (0.004)<br />
Pop. Den. (log) -0.018** 0.004 -0.000 -0.004** 0.001** -0.004 -0.015 0.004<br />
× after 1970 (0.007) (0.003) (0.001) (0.002) (0.000) (0.018) (0.010) (0.003)<br />
Pop. Den. (log) -0.003** -0.005*** 0.000 0.000 0.000 -0.001 -0.003** 0.001**<br />
× t since 1970 (0.001) (0.001) (0.000) (0.000) (0.000) (0.002) (0.001) (0.000)<br />
Observations 1056 1056 912 912 912 1056 1056 1056<br />
R 2 0.989 1.000 0.987 0.991 0.929 0.983 0.979 0.975<br />
Notes: Robust standard errors in parentheses, with two-way clustering by state and by year; p = 10% * ,<br />
5% ** , 1% *** All regressions include time f.e., state f.e., and state-specific linear time trends. Independent<br />
variables interacted with the 1970 break are 1970 values. Income and Population Density are logarithms.<br />
Manufacturing %, Polluting Manufacturing %, and Utilities % are shares of state GDP. Polluting manufacturing<br />
industries are: Paper and allied products (SIC 26), Chemicals and allied products (SIC 28),<br />
Petroleum and coal products (SIC 29), Stone, clay, glass, and concrete (SIC 32), Primary metal industries<br />
(SIC 33). Fossil Fuels is the log of consumption relative to income. Coal % and Motor Gasoline %<br />
are shares of fossil-fuel consumption.<br />
57<br />
45
Figure 4 —Information and the Impact of the CAA on Personal Income<br />
Sources: Newspaper circulation is from Gentzkow, Shapiro, and Sinkinson (2011), and personal income<br />
from the BEA Regional Economic Accounts.<br />
70<br />
46
Figure 5 —Information and the Impact of the CAA on Population Density<br />
Sources: Newspaper circulation is from Gentzkow, Shapiro, and Sinkinson (2011), and population density<br />
from the U.S. Census.<br />
71<br />
47
Figure 6 —Information and the Impact of the CAA on Polluting Industries<br />
Sources: Newspaper circulation is from Gentzkow, Shapiro, and Sinkinson (2011), and value added<br />
from the BEA Regional Economic Accounts. Polluting manufacturing industries are: Paper and allied<br />
products (SIC 26), Chemicals and allied products (SIC 28), Petroleum and coal products (SIC 29), Stone,<br />
clay, glass, and concrete (SIC 32), Primary metal industries (SIC 33).<br />
72<br />
48
any case, the economic impact of such displacement is quantitatively minimal. Considering<br />
two states whose 1970 newspaper circulation differed by one standard deviation (.05<br />
copies per person), the rate of decline of pollutant emissions in the 1970s compared to<br />
the 1960s was higher in the less informed state by 1-2 percentage points per year. At the<br />
same time, its share of value added in polluting manufacturing industries would suffer a<br />
one-time decline by 0.1 percentage points.<br />
There is no evidence of displacement for manufacturing as a whole, nor for the single<br />
most polluting sector, Electric, gas, and sanitary services (SIC 49, which is not a<br />
manufacturing industry). If the differential reduction in pollution in uninformed states<br />
after 1970 was accompanied by a change in the composition of economic activity, this<br />
change was of very limited size, and restricted in scope to highly polluting manufacturing<br />
industries.<br />
Having ruled out changes in scale and substantial changes in composition, we conclude<br />
that the differential impact of the Clean Air Act operated through differential improvement<br />
in technique. Our baseline analysis showed that uninformed states achieved faster<br />
reductions in the emission intensity of income after 1970. Table 9 explores the channel<br />
in greater detail and finds evidence in particular of an impact on the fuel intensity of<br />
income. As Figure 7 also shows, after the creation of the EPA aggregate consumption of<br />
fossil fuels fell more quickly in states with lower newspaper circulation. In this case, too,<br />
the impact appears to be entirely on technique and not on composition, since there is no<br />
differential effect on the share of coal or of motor gasoline in total fuel consumption.<br />
4 Conclusions<br />
Political accountability and the quality of government vary across regions within a country<br />
like the United States, and across member states of international organizations like the<br />
European Union. In this paper, we have shown that such regional differences imply that<br />
centralization increases political accountability.<br />
Our model emphasizes the role of differences in voters’ information.<br />
Rent-seeking<br />
politicians have better incentives when their constituents are more informed about the<br />
provision of public goods. We have shown that electoral discipline has decreasing returns.<br />
Therefore, a central politician answerable to the whole national electorate extracts lower<br />
rents than a collection of local politicians, some monitored tightly by well-informed voters<br />
and some loosely by poorly-informed constituents. Hence, we have found that centralization<br />
reduces rent extraction whenever voter information is heterogeneous across regions.<br />
This result can help to explain the steady growth of the federal government over the<br />
history of the United States, and the sharp increase in the scope and extent of the powers<br />
one-way clustering. If we rely, conservatively, on the larger of the two standard errors, the null hypothesis<br />
of no differential impact cannot be rejected (Table A9).<br />
33<br />
49
Figure 7 —Information and the Impact of the CAA on Fuel Consumption<br />
Sources: Newspaper circulation is from Gentzkow, Shapiro, and Sinkinson (2011), fossil fuel consumption<br />
from the EIA State Energy Data System, and personal income from the BEA Regional Economic<br />
Accounts.<br />
73<br />
50
of the European Union since the 1970s (Alesina, Angeloni, and Schuknecht 2005).<br />
Our model also predicts distributional consequences of centralization when regions<br />
have different levels of information. When the central government provides public goods<br />
uniformly across the union, the benefits of centralization are monotone decreasing in<br />
voter information. We have tested this prediction by analyzing the differential impact of<br />
the 1970 Clean Air Act across the United States. Beforehand, environmental regulation<br />
was in the hands of state and local governments. In 1970, the federal government took<br />
charge and started introducing uniform national standards. We have found significant<br />
and robust evidence of differences-in-differences. Consistent with our theoretical model,<br />
centralization of environmental policy induced a faster decline in pollution in states with<br />
lower newspaper readership.<br />
The finding that centralization benefits the least informed regions hinges on uniform<br />
public goods provision, as in the case of national air quality standards for pollutant<br />
emissions. In our model, we have shown conversely that if the central politician can<br />
differentiate local public goods provision across regions, he targets the most informed.<br />
While uniform policy entails a transfer of accountability from the informed to the uninformed,<br />
discretionary spending reflects a transfer of power from the uninformed to<br />
the informed. Thus we have identified the balancing role of a uniformity requirement<br />
for central-government policies. Some uniformity is necessary for centralization to be<br />
welfare increasing. A carefully calibrated constraint can ensure the Pareto effi ciency of<br />
centralization.<br />
34<br />
51
A<br />
Derivations and Proofs<br />
A.1. Proof of Proposition 1<br />
The budget allocation and the expectation of the incumbent’s ability are derived in the<br />
body of the text. The cumulative distribution function of ˆη p,t is<br />
Ψ t ≤<br />
J∑<br />
λ j θ j<br />
j=1<br />
P<br />
∑<br />
p=1<br />
α j pε p,t .<br />
(A1)<br />
Pr (ˆη p,t ≤ η ) = Pr [ ( ( ) ( ) ]<br />
χ t−1 ε<br />
I<br />
p,t−1 + εp,t) I + 1 − χt−1 ε<br />
C<br />
p,t−1 + ε C p,t ≤ η<br />
= Pr ( χ t−1 = 1 ∧ ε I p,t−1 + ε I p,t ≤ η ) + Pr ( χ t−1 = 0 ∧ ε C p,t−1 + ε C p,t ≤ η )<br />
(<br />
J∑ P<br />
)<br />
∑<br />
= Pr Ψ t−1 ≤ λ j θ j α j pε p,t−1 ∧ ε I p,t−1 + ε I p,t ≤ η<br />
=<br />
j=1<br />
p=1<br />
+ 1 2 Pr ( ε C p,t−1 + ε C p,t ≤ η )<br />
∫ (<br />
)<br />
∞<br />
J∑<br />
1 + εφ λ j θ j α j p F ε (η − ε) f ε (ε) dε,<br />
−∞<br />
j=1<br />
(A2)<br />
where F ε (ε) is the cumulative distribution function of ε p,t and f ε (ε) its probability density<br />
function. Since<br />
∫ ∞<br />
−∞<br />
εF ε (η − ε) f ε (ε) dε = E [εF ε (η − ε)] < EεE [F ε (η − ε)] = 0,<br />
(A3)<br />
an increase in φ ∑ J<br />
j=1 λ jθ j α j p induces an increase in ˆη p in the sense of first-order stochastic<br />
dominance.<br />
A.2.<br />
A.2..1<br />
Equilibrium with Many Regions<br />
Decentralization<br />
By Proposition 1, under decentralization rent extraction is<br />
ρ D l =<br />
[<br />
1 + 2˜δφ<br />
(<br />
1 − L − 1<br />
L<br />
the expected ability of a local politician is<br />
(<br />
Eˆη D l,p = φσ 2 1 − L − 1<br />
L<br />
) ] −1<br />
P∑<br />
ξ p α l p θ l ,<br />
p=1<br />
ξ p<br />
)<br />
α l pθ l ,<br />
(A4)<br />
(A5)<br />
and the relative shares of each local public good are<br />
β D l,p =<br />
(<br />
1 −<br />
L−1<br />
ξ L p)<br />
α<br />
l<br />
p<br />
∑<br />
1 − L−1 P<br />
L q=1 ξ . (A6)<br />
qα l q<br />
35<br />
52
Welfare in region l is<br />
Eu D l = log b +<br />
P∑<br />
p=1<br />
α l p<br />
{ ( ) [ ( ) ]<br />
1 − ξp log 1 − ρ<br />
D<br />
l + Eˆη<br />
D<br />
l,p + log β D l,p<br />
+ ξ ∑<br />
p L<br />
[ ( ) ]<br />
L m=1 log 1 − ρ<br />
D<br />
m + Eˆη<br />
D<br />
m,p + log β D m,p<br />
}<br />
, (A7)<br />
and aggregate welfare is<br />
W D = log b + 1 L<br />
L∑<br />
l=1<br />
P∑<br />
p=1<br />
[(<br />
1 − ξp<br />
)<br />
α<br />
l<br />
p + ξ p ᾱ p<br />
] [<br />
log<br />
(<br />
1 − ρ<br />
D<br />
l<br />
)<br />
+ Eˆη<br />
D<br />
l,p + log β D l,p]<br />
. (A8)<br />
for<br />
ᾱ p = 1 L<br />
L∑<br />
α l p.<br />
(A9)<br />
l=1<br />
A.2..2<br />
Centralization<br />
By Proposition 1, under centralization rent extraction is<br />
ρ C =<br />
( ) −1 1<br />
1 + 2˜δφ¯θ for ¯θ =<br />
L<br />
L∑<br />
θ l ,<br />
l=1<br />
(A10)<br />
the expected ability of a central politician is<br />
Eˆη C p<br />
= φσ2<br />
L<br />
L∑<br />
θ l α l p,<br />
l=1<br />
(A11)<br />
and the relative shares of each local public good are<br />
and<br />
β C l,p = 1 L<br />
Welfare in region l is<br />
β C p = 1 L 2 L<br />
∑<br />
l=1<br />
[<br />
(1<br />
− ξp<br />
) θ l<br />
¯θ<br />
α l p + ξ p<br />
L<br />
θ l<br />
¯θ<br />
α l p for p ∈ U<br />
]<br />
L∑ θ<br />
α m¯θ m p<br />
m=1<br />
for p ∈ D.<br />
(A12)<br />
(A13)<br />
Eu l = log (Lb) + log ( 1 − ρ C) P∑<br />
+ α l pEˆη C p + ∑ α l p log β C p<br />
p=1 p∈U<br />
[<br />
P∑ (1 )<br />
+ α l p − ξp log β<br />
C<br />
l,p + ξ p<br />
L<br />
p∈D<br />
]<br />
L∑<br />
log β C m,p<br />
m=1<br />
(A14)<br />
36<br />
53
and aggregate welfare is<br />
W C = log (Lb) + log ( 1 − ρ C) P∑<br />
+ ᾱ p Eˆη C p + ∑ ᾱ p log β C p<br />
p=1 p∈U<br />
[<br />
+ 1 L∑ P∑ (1 )<br />
α l p − ξp log β<br />
C<br />
l,p + ξ p<br />
L<br />
L<br />
l=1 p∈D<br />
A.3. Proof of Proposition 2<br />
Aggregate rent extraction is lower under centralization if and only if<br />
]<br />
L∑<br />
log β C m,p . (A15)<br />
m=1<br />
ρ C ≤ 1 L<br />
L∑<br />
ρ D l ,<br />
l=1<br />
(A16)<br />
which can be written<br />
(<br />
1<br />
f<br />
L<br />
)<br />
L∑<br />
θ l ≤ 1 L<br />
l=1<br />
((<br />
L∑<br />
f 1 − L − 1<br />
L<br />
l=1<br />
) )<br />
P∑<br />
ξ p α l p θ l<br />
p=1<br />
(A17)<br />
for<br />
f (x) ≡<br />
1<br />
1 + 2˜δφx<br />
a strictly decreasing and strictly convex function of x > 0:<br />
f ′ 2˜δφ<br />
(x) = −(<br />
) 2<br />
< 0 and f ′′ (x) =<br />
1 + 2˜δφx<br />
(A18)<br />
( ) 2<br />
2˜δφ<br />
( ) 3<br />
> 0. (A19)<br />
1 + 2˜δφx<br />
Thus<br />
f<br />
(<br />
1<br />
L<br />
)<br />
L∑<br />
θ l ≤ 1 L<br />
l=1<br />
L∑<br />
f (θ l ) ≤ 1 L<br />
l=1<br />
((<br />
L∑<br />
f 1 − L − 1<br />
L<br />
l=1<br />
) )<br />
P∑<br />
ξ p α l p θ l . (A20)<br />
p=1<br />
The first inequality follows from convexity by Jensen’s inequality and holds strictly if θ l<br />
is heterogeneous across regions. The second inequality follows from monotonicity and<br />
holds strictly if ξ p > 0 for some p. Ability<br />
Average effi ciency in providing public good p is higher under centralization if and only<br />
if<br />
Eˆη C p ≥ 1 L∑<br />
Eˆη D l,p ⇐⇒ ξ<br />
L<br />
p ≥ 0,<br />
(A21)<br />
with joint strict inequality.<br />
l=1<br />
37<br />
54
A.4. Proof of Proposition 3<br />
A.4..1<br />
The Decentralization Theorem<br />
Suppose that all public goods provided by the central government are subject to the<br />
uniformity constraint (D = ∅) and that information is homogeneous across regions (θ l =<br />
θ for all l). Then under centralization<br />
ρ C =<br />
while under decentralization<br />
[<br />
and<br />
( ) −1<br />
1 + 2˜δφθ , Eˆη<br />
C<br />
p = φσ 2 θᾱ p , and β C p = 1 (A22)<br />
Lᾱp.<br />
ρ D l =<br />
1 + 2˜δφθ<br />
(<br />
1 − L − 1<br />
L<br />
−1<br />
P∑<br />
ξ p αp)] l , (A23)<br />
p=1<br />
(<br />
Eˆη D l,p = φσ 2 θ 1 − L − 1 )<br />
L<br />
ξ p α l p,<br />
(<br />
β D l,p = 1 − L − 1 )<br />
L<br />
ξ p α l p.<br />
(A24)<br />
(A25)<br />
1. If there are no externalities and preferences are homogeneous (α l p = α p for all l and<br />
ξ p = 0 for all p), then<br />
ρ C = ρ D l =<br />
( ) −1<br />
1 + 2˜δφθ , Eˆη<br />
C<br />
p = Eˆη D l,p = φσ 2 θα p and Lβ C p = β D l,p = α p . (A26)<br />
2. If there are externalities and preferences are homogeneous (α l p = α p for all l, while<br />
ξ p > 0 for some p), then under centralization<br />
ρ C =<br />
( ) −1<br />
1 + 2˜δφθ , Eˆη<br />
C<br />
p = φσ 2 θα p , and Lβ C p = α p , (A27)<br />
and<br />
Under decentralization<br />
[<br />
W C = log b + log ( 1 − ρ C) +<br />
ρ D l =<br />
1 + 2˜δφθ<br />
(<br />
1 − L − 1<br />
L<br />
P∑<br />
p=1<br />
α p<br />
(<br />
Eˆη<br />
C<br />
p + log α p<br />
)<br />
.<br />
)] −1<br />
P∑<br />
ξ p α p > ρ C ,<br />
p=1<br />
(<br />
Eˆη D l,p = φσ 2 θ 1 − L − 1 )<br />
L<br />
ξ p α p < Eˆη C p ,<br />
(<br />
1 −<br />
L−1<br />
β D L<br />
l,p =<br />
ξ p)<br />
αp<br />
∑<br />
1 − L−1 P<br />
L q=1 ξ ,<br />
qα q<br />
(A28)<br />
(A29)<br />
(A30)<br />
(A31)<br />
38<br />
55
and<br />
W D = log b + log ( 1 − ρ D l<br />
)<br />
+<br />
P<br />
∑<br />
p=1<br />
α p<br />
(<br />
Eˆη<br />
D<br />
l,p + log β D l,p)<br />
. (A32)<br />
Centralization achieves the optimal allocation of productive expenditures, while<br />
decentralization does not unless ξ p is homogeneous across goods.<br />
Thus welfare is lower under decentralization due to increased rent extraction, lower<br />
government effi ciency, and also misallocation of expenditures across public goods<br />
unless ξ p is homogeneous across goods.<br />
3. If there are no externalities and preferences are heterogeneous (ξ p = 0 for all p,<br />
while α l p ≠ α m p for some l ≠ m and p), then under centralization<br />
W C = log b + log ( 1 − ρ C) + 1 L<br />
L∑<br />
l=1<br />
P∑<br />
p=1<br />
α l p<br />
[<br />
Eˆη<br />
C<br />
p + log ( )]<br />
Lβ C p , (A33)<br />
A.4..2<br />
while under decentralization<br />
(<br />
−1<br />
ρ D l = 1 + 2˜δφθ)<br />
= ρ C , Eˆη D l,p = φσ 2 θα l p, β D l,p = α l p (A34)<br />
and<br />
W D = log b + log ( 1 − ρ D l<br />
)<br />
+<br />
1<br />
L<br />
L∑<br />
l=1<br />
P∑<br />
p=1<br />
α l p<br />
(<br />
Eˆη<br />
D<br />
l,p + log β D l,p)<br />
. (A35)<br />
Decentralization achieves the optimal allocation of productive expenditures, while<br />
centralization does not. Moreover, decentralization achieves a better screening of<br />
politicians<br />
1<br />
L∑ P∑<br />
α l<br />
L<br />
pEˆη D l,p > 1 L∑ P∑<br />
α l<br />
L<br />
pEˆη C p<br />
(A36)<br />
l=1<br />
because for each public good p<br />
unless α l p = α p for all l.<br />
1<br />
L<br />
Effi cient Centralization<br />
p=1<br />
L∑<br />
l=1<br />
(<br />
α<br />
l<br />
p<br />
) 2<br />
><br />
(<br />
1<br />
L<br />
l=1<br />
p=1<br />
2<br />
L∑<br />
αp) l (A37)<br />
Suppose that all public goods provided by the central government are subject to the<br />
uniformity constraint (D = ∅) and that preferences are homogeneous (α l p = α p for all l).<br />
Then under centralization<br />
( ) −1<br />
ρ C = 1 + 2˜δφ¯θ , Eˆη<br />
C<br />
p = φσ 2 α p¯θ, β<br />
C<br />
p = α p , (A38)<br />
l=1<br />
and<br />
W C = log b + log ( 1 − ρ C) +<br />
P∑<br />
p=1<br />
( )<br />
α p Eˆη<br />
C<br />
p + log β C p . (A39)<br />
39<br />
56
and<br />
Under decentralization<br />
W D = 1 L<br />
ρ D l =<br />
l=1<br />
[<br />
1 + 2˜δφ<br />
(<br />
1 − L − 1<br />
L<br />
) ] −1<br />
P∑<br />
ξ p α p θ l , (A40)<br />
p=1<br />
(<br />
Eˆη D l,p = φσ 2 1 − L − 1 )<br />
L<br />
ξ p α p θ l ,<br />
(<br />
1 −<br />
L−1<br />
β D L<br />
l,p =<br />
ξ p)<br />
αp<br />
∑<br />
1 − L−1 P<br />
L q=1 ξ ,<br />
qα q<br />
p=1<br />
(A41)<br />
(A42)<br />
[<br />
L∑<br />
log b + log ( ) ∑ P<br />
(<br />
1 − ρ D l + α p Eˆη<br />
D<br />
l,p + log βl,p) ] D . (A43)<br />
1. The welfare cost of rent extraction falls with centralization:<br />
log ( 1 − ρ C) > 1 L<br />
L∑<br />
log ( 1 − ρ D l<br />
)<br />
(A44)<br />
l=1<br />
which can be written<br />
( )<br />
1<br />
L∑<br />
f θ l > 1 L L<br />
l=1<br />
((<br />
L∑<br />
f 1 − L − 1<br />
L<br />
l=1<br />
) )<br />
P∑<br />
ξ p α p θ l<br />
p=1<br />
(A45)<br />
for<br />
( )<br />
f (x) ≡ log x − log 1 + 2˜δφx<br />
(A46)<br />
a strictly increasing and strictly concave function of x > 0:<br />
f ′ (x) =<br />
1<br />
( ) > 0 and f ′′ (x) = −<br />
x 1 + 2˜δφx<br />
[<br />
x<br />
1 + 4˜δφx<br />
( )] 2<br />
< 0. (A47)<br />
1 + 2˜δφx<br />
Thus<br />
f<br />
(<br />
1<br />
L<br />
)<br />
L∑<br />
θ l ≥ 1 L<br />
l=1<br />
L∑<br />
f (θ l ) ≥ 1 L<br />
l=1<br />
((<br />
L∑<br />
f 1 − L − 1<br />
L<br />
l=1<br />
) )<br />
P∑<br />
ξ p α p θ l . (A48)<br />
p=1<br />
The first inequality follows from convexity by Jensen’s inequality and holds strictly if<br />
θ l is heterogeneous across regions. The second inequality follows from monotonicity<br />
and holds strictly if ξ p > 0 for some p.<br />
2. Average ability increases under centralization for all public goods, as proved in<br />
Proposition 2.<br />
3. Centralization achieves the optimal allocation of productive expenditures, while<br />
decentralization does not unless ξ p is homogeneous across public goods.<br />
Thus centralization increases welfare whenever information is heterogeneous (θ l ≠ θ m<br />
40<br />
57
for some l ≠ m) or there are externalities in the provision of public goods (ξ p > 0 for<br />
some p).<br />
A.5. Proof of Proposition 4<br />
Suppose that all public goods provided by the central government are subject to the<br />
uniformity constraint (D = ∅), and that preferences are homogeneous across regions<br />
(α l p = α p for all l). Then public goods provision in region l is<br />
gl,p,t D = x D p,t exp (ˆη ) D<br />
l,p = β<br />
D<br />
l,pb ( D 1 − ρ D l<br />
) )<br />
exp<br />
D<br />
(ˆη l,p<br />
(A49)<br />
under decentralization, and<br />
g C l,p,t = 1 L xC p,t exp (ˆη C p<br />
)<br />
= β<br />
C<br />
p b ( D 1 − ρ C) exp (ˆη )<br />
C<br />
p<br />
(A50)<br />
under centralization.<br />
The proof of Proposition 3 has established that ∂β D l,p/∂θ l = 0 and ∂ρ D l /∂θ l < 0.<br />
Recalling the proof of Proposition 1, ˆη D l,p is increasing in θ l in the sense of first-order<br />
stochastic dominance, so ∂E exp (ˆη l,p) D /∂θl > 0. Since gl,p,t C is identical for all regions, it<br />
follows that<br />
E ( g C l,p − g D l,p)<br />
> E<br />
(<br />
g<br />
C<br />
m,p − g D m,p)<br />
⇔ Eg<br />
D<br />
l,p < Eg D m,p ⇔ θ l < θ m . (A51)<br />
Similarly for residents’welfare<br />
E ( u C l − u D l<br />
P∑<br />
and<br />
p=1<br />
) ( )<br />
> E u<br />
C<br />
m − u D m ⇔ Eu<br />
D<br />
l < Eu D m ⇔<br />
] ∑ P<br />
<<br />
α p<br />
(<br />
1 − ξp<br />
) [<br />
log<br />
(<br />
1 − ρ<br />
D<br />
l<br />
)<br />
+ Eˆη<br />
D<br />
l,p<br />
p=1<br />
α p<br />
(<br />
1 − ξp<br />
) [<br />
log<br />
(<br />
1 − ρ<br />
D<br />
l<br />
)<br />
+ Eˆη<br />
D<br />
l,p]<br />
⇔<br />
θ l < θ m<br />
(A52)<br />
If furthermore there are no externalities (ξ p = 0 for all p) then under decentralization<br />
Eu D l<br />
ρ D l =<br />
(<br />
1 + 2˜δφθ l<br />
) −1<br />
, Eˆη<br />
D<br />
l,p = φσ 2 α p θ l , β D l,p = α p ,<br />
= log b D + log ( 1 − ρ D l<br />
)<br />
+<br />
P<br />
∑<br />
p=1<br />
α l p<br />
(A53)<br />
(<br />
Eˆη<br />
D<br />
l,p + log β D l,p)<br />
. (A54)<br />
If and only if θ l ≤ ¯θ then ρ D l ≥ ρ C , Eˆη D l,p ≤ Eˆη C p , Eu D l ≤ Eu C l , E exp (ˆη ) D<br />
l,p ≤ E exp<br />
C<br />
(ˆη<br />
and Egl,p D ≤ EgC l,p , with joint strict inequalities.<br />
A.6. Proof of Proposition 5<br />
Suppose that preferences are homogeneous, information is heterogeneous, and there are<br />
no externalities (α l p = α p for all l, θ l ≠ θ m for some l ≠ m, and ξ p = 0 for all p). Under<br />
l,p)<br />
,<br />
41<br />
58
decentralization, welfare in region l is<br />
Eu D l<br />
= log b + log ( 1 − ρ D l<br />
)<br />
+<br />
P<br />
∑<br />
p=1<br />
α p<br />
(<br />
Eˆη<br />
D<br />
l,p + log β D l,p)<br />
, (A55)<br />
for<br />
Aggregate welfare is<br />
ρ D l =<br />
(<br />
1 + 2˜δφθ l<br />
) −1<br />
, Eˆη<br />
D<br />
l,p = φσ 2 α p θ l , and β D l,p = α p .<br />
(A56)<br />
P∑<br />
W D = log b + α p log α p + φσ 2¯θ<br />
p=1<br />
p=1<br />
P∑<br />
α 2 p + 1 L<br />
L∑ 2˜δφθ l<br />
log<br />
(A57)<br />
1 + 2˜δφθ l<br />
l=1<br />
Under centralization, welfare in region l is<br />
Eu l = log (Lb) + log ( 1 − ρ C) P∑<br />
+ α p Eˆη C p + ∑ α p log β C p +<br />
p=1 p∈U<br />
P∑<br />
α p log β C l,p<br />
p∈D<br />
(A58)<br />
for<br />
ρ C =<br />
( ) −1<br />
1 + 2˜δφ¯θ , Eˆη<br />
C<br />
p = φσ 2 α p¯θ, β<br />
C<br />
p = α p<br />
L for p ∈ U, βC l,p = α p θ l<br />
for p ∈ D. (A59)<br />
L ¯θ<br />
Aggregate welfare is<br />
W C = log b +<br />
P∑<br />
α p log α p + φσ 2¯θ<br />
p=1<br />
+ log<br />
P∑<br />
p=1<br />
α 2 p<br />
(<br />
2˜δφ¯θ<br />
1 + 2˜δφ¯θ + (1 − α 1<br />
U)<br />
L<br />
)<br />
L∑<br />
log θ l − log ¯θ . (A60)<br />
l=1<br />
Then aggregate welfare is greater under centralization if<br />
( ) ∑ )<br />
log 1 + 2˜δφ¯θ − 1 L<br />
L l=1<br />
(1 log + 2˜δφθ l<br />
α U ≥<br />
log ¯θ ∑<br />
− 1 L<br />
L l=1 log θ l<br />
Region l gains from centralization if<br />
≡ ᾱ U ∈ (0, 1) .<br />
(A61)<br />
log 1 + 2˜δφθ l<br />
1 + 2˜δφ¯θ − α U log θ l<br />
¯θ<br />
≥ φσ 2<br />
P<br />
∑<br />
p=1<br />
α 2 p<br />
(<br />
θl − ¯θ ) . (A62)<br />
The function<br />
has a unique minimum<br />
( )<br />
f (x) ≡ log 1 + 2˜δφx − α U log x<br />
(A63)<br />
f ′ (x) =<br />
2˜δφ<br />
1 + 2˜δφx − α U<br />
x ≥ 0 ⇔ x ≥<br />
α U<br />
2˜δφ (1 − α U ) ,<br />
(A64)<br />
42<br />
59
and convexity<br />
Hence if<br />
f ′′ (x) = −<br />
(<br />
2˜δφ<br />
1 + 2˜δφx<br />
α U =<br />
) 2<br />
+ α U<br />
x 2 > 0 ⇔ α U ><br />
(<br />
2˜δφx<br />
1 + 2˜δφx<br />
) 2<br />
(A65)<br />
2˜δφ¯θ<br />
1 + 2˜δφ¯θ = 1 − ρC (A66)<br />
the left-hand side of condition A62 is a convex function of θ l ∈ [0, 1] with minimum at<br />
θ l = ¯θ. This also proves that<br />
ᾱ U < 1 − ρ C .<br />
(A67)<br />
Moreover, let<br />
Then for<br />
σ 2 ≤<br />
{<br />
m = arg min θl : θ l > ¯θ } . (A68)<br />
l=1,...,L<br />
{<br />
}<br />
1<br />
φ ∑ P<br />
(<br />
p=1 α2 p θm − ¯θ ) log 1 + 2˜δφθ m<br />
1 + 2˜δφ¯θ − 2˜δφ¯θ<br />
1 + 2˜δφ¯θ log θ ≡ ¯σ<br />
m¯θ<br />
2 > 0,<br />
(A69)<br />
centralization Pareto dominates decentralization for α U = ρ C . Any region with θ l = ¯θ is<br />
always indifferent between the two. Region m is also indifferent if σ 2 = ¯σ 2 , and strictly<br />
prefers centralization otherwise. Any regions with θ l < ¯θ or θ l > θ m strictly prefer<br />
centralization.<br />
43<br />
60
References<br />
[1] Adserà, Alícia, Carles Boix, and Mark Payne. 2003. “Are You Being Served? Political<br />
Accountability and the Quality of Government.” Journal of Law, Economics, and<br />
Organization 19(2): 445—90<br />
[2] Alesina, Alberto, Ignazio Angeloni, and Federico Etro. 2005. “International Unions.”<br />
American Economic Review 95(3): 602—15.<br />
[3] Alesina, Alberto, Ignazio Angeloni, and Ludger Schuknecht. 2005. “What Does the<br />
European Union Do?”Public Choice 123(3): 275—319.<br />
[4] Alesina, Alberto, and Enrico Spolaore. 1997. “On the Number and Size of Nations.”<br />
Quarterly Journal of Economics 112(4): 1027—56.<br />
[5] Bardhan, Pranab, and Dilip Mookherjee. 2000. “Capture and Governance at Local<br />
and National Levels.”American Economic Review 90(2): 135—9.<br />
[6] – – . 2006. “Decentralization, Corruption, and Government Accountability.” In<br />
International Handbook on the Economics of Corruption, edited by Susan Rose-<br />
Ackerman, 161—88. Cheltenham: Edward Elgar.<br />
[7] Bayer, Patrick, Nathaniel Keohane, and Christopher Timmins. 2009. “Migration and<br />
hedonic valuation: The case of air quality.”Journal of Environmental Economics and<br />
Management 58(1): 1—14.<br />
[8] Becker, Randy and Vernon Henderson. 2000. “Effects of Air Quality Regulations on<br />
Polluting Industries.”Journal of Political Economy 108(2): 379—421.<br />
[9] Besley, Timothy, and Robin Burgess. 2002. “The Political Economy of Government<br />
Responsiveness: Theory and Evidence from India.”Quarterly Journal of Economics<br />
117(4): 1415—51.<br />
[10] Besley, Timothy, and Anne Case. 1995. “Incumbent Behavior: Vote-Seeking, Tax-<br />
Setting, and Yardstick Competition.”American Economic Review 85(1): 25—45.<br />
[11] Besley, Timothy, and Stephen Coate. 2003. “Centralized Versus Decentralized Provision<br />
of Local Public Goods: A Political Economy Approach.” Journal of Public<br />
Economics 87: 2611—37.<br />
[12] Besley, Timothy, and Michael Smart. 2007. “Fiscal Restraints and Voter Welfare.”<br />
Journal of Public Economics 91: 755—73.<br />
[13] Blanchard, Olivier, and Andrei Shleifer. 2001. “Federalism With and Without Political<br />
Centralization: China Versus Russia.”IMF Staff Papers 48(4): 171—9.<br />
[14] Bulte, Erwin, John List, and Mark Strazicich. 2007. “Regulatory Federalism and<br />
the Distribution of Air Pollutant Emissions”, Journal of Regional Science, 47(1):<br />
155—78.<br />
[15] Cameron, A. Colin, Jonah B. Gelbach, and Douglas L. Miller. 2011. “Robust Inference<br />
With Multiway Clustering.”Journal of Business & Economic Statistics 29(2):<br />
238—49.<br />
44<br />
61
[16] Campa, Pamela. 2013. “Press and Leaks: Do Newspapers Reduce Toxic Emissions?”<br />
Mimeo, Stockholm University.<br />
[17] Charron, Nicholas, Lewis Dijkstra, and Victor Lapuente. 2013. “Regional Governance<br />
Matters: A Study on Regional Variation in Quality of Government within the<br />
EU.”Regional Studies, forthcoming.<br />
[18] Chay, Kenneth, and Michael Greenstone. 2003. “The Impact of Air Pollution on<br />
Infant Mortality: Evidence from Geographic Variation in Pollution Shocks Induced<br />
by a Recession.”Quarterly Journal of Economics 118: 1121—67.<br />
[19] – – . 2005. “Does Air Quality Matter: Evidence from the Housing Market.”Journal<br />
of Political Economy. 116: 376-424.<br />
[20] Currie, Janet and Schmieder, Johannes. 2009. “Fetal Exposures to Toxic Releases<br />
and Infant Health.”American Economic Review Papers and Proceedings 99(2): 177—<br />
183.<br />
[21] Del Monte, Alfredo, and Erasmo Papagni. 2001. “Public Expenditure, Corruption<br />
and Economic Growth: The Case of Italy.”European Journal of Political Economy<br />
17: 1—16.<br />
[22] – – . 2007. “The Determinants of Corruption in Italy: Regional Panel Data Analysis.”European<br />
Journal of Political Economy 23: 379—96.<br />
[23] Dincecco, Mark. 2011. Political Transformations and Public Finances. Cambridge,<br />
UK: Cambridge University Press.<br />
[24] Dincecco, Mark, and Gabriel Katz. 2012. “State Capacity and Long-Run Performance.”Mimeo,<br />
IMT Lucca.<br />
[25] Durante, Ruben, Giovanna Labartino, and Roberto Perotti. 2011. “Academic Dynasties:<br />
Decentralization and Familism in the Italian Academia.” NBER Working<br />
Paper No 17572.<br />
[26] Fan, C. Simon, Chen Lin, and Daniel Treisman. 2009. “Political Decentralization<br />
and Corruption: Evidence from Around the World.” Journal of Public Economics<br />
93(1-2): 14—34.<br />
[27] Ferraz, Claudio, and Frederico Finan. 2008. “Exposing Corrupt Politicians: The Effects<br />
of Brazil’s Publicly Released Audits on Electoral Outcomes.”Quarterly Journal<br />
of Economics 123(2): 703—45.<br />
[28] Fredriksson, Per and Noel Gaston. 2000. “Environmental Governance in Federal<br />
Systems: the Effects of Capital Competition and Lobby Groups.”Economic Inquiry,<br />
38(3): 501—14.<br />
[29] Gennaioli, Nicola, and Ilia Rainer. 2007a. “The Modern Impact of Precolonial Centralization<br />
in Africa.”Journal of Economic Growth 12(3): 185—234.<br />
[30] – – . 2007b. “Precolonial Centralization and Institutional Quality in Africa.” In<br />
Institutions and Norms in Economic Development, edited by Mark Gradstein and<br />
Kai Konrad. Cambridge, MA: MIT Press.<br />
45<br />
62
[31] Gennaioli, Nicola, and Hans-Joachim Voth. 2011. “State Capacity and Military Conflict.”CEPR<br />
Discussion Paper No. 8699.<br />
[32] Gentzkow, Matthew. 2006. “Television and voter turnout.” Quarterly Journal of<br />
Economics 121(3): 931—72.<br />
[33] Gentzkow, Matthew, Jesse Shapiro, and Michael Sinkinson. 2011. “The Effect of<br />
Newspaper Entry and Exit on Electoral Politics.”American Economic Review 101:<br />
2980—3018.<br />
[34] Glaeser, Edward L., Giacomo A. M. Ponzetto, and Jesse M. Shapiro. 2005. “Strategic<br />
Extremism: Why Republicans and Democrats Divide on Religious Values.” Quarterly<br />
Journal of Economics 120(4): 1283—330.<br />
[35] Golden, Miriam A., and Lucio Picci. 2005. “Proposal for a New Measure of Corruption,<br />
Illustrated with Italian Data.”Economics and Politics 17(1): 37—75.<br />
[36] Graber, Doris A. 1984. Processing the News: How People Tame the Information<br />
Tide. New York, NY: Longman.<br />
[37] Gray, Wayne B. and Ronald J. Shadbegian. 2004. “‘Optimal’Pollution Abatement:<br />
Whose Benefits Matter, and How Much?”Journal of Environmental Economics and<br />
Management 47(3): 510—34.<br />
[38] Greenstone, Michael. 2002. “The impacts of environmental regulations on industrial<br />
activity: evidence from the 1970 and 1977 clean air act amendments and the census<br />
of manufacturers.”Journal of Political Economy. 110: 1175—1219.<br />
[39] – – . 2004. “Did the Clean Air Act Cause the Remarkable Decline in Sulfur Dioxide<br />
Concentrations?” Journal of Environmental Economics and Management. 47: 585-<br />
611.<br />
[40] Greenstone, Michael, John List, and Chad Syverson. 2012 “The Effects of Environmental<br />
Regulation on the Competitiveness of U.S. Manufacturing.”Mimeo, MIT.<br />
[41] Henderson, J. Vernon. 1996. “Effects of air quality regulation.”American Economic<br />
Review 86: 789—813.<br />
[42] Holmström, Bengt. [1982] 1999. “Managerial Incentive Problems: A Dynamic Perspective.”Review<br />
of Economic Studies 66(1): 169—82.<br />
[43] Kahn, Matthew E. 1996. “New evidence on trends in vehicle emissions.”Rand Journal<br />
of Economics 27(1): 183—96.<br />
[44] – – . 1997. “Particulate Pollution Trends in the United States.” Regional Science<br />
and Urban Economics 27(1): 87—107.<br />
[45] Lindbeck, Assar, and Jörgen W. Weibull. 1987. “Balanced-Budget Redistribution as<br />
the Outcome of Political Competition.”Public Choice 52: 273—97.<br />
[46] List, John, and Craig Gallet. 1999. “The Environmental Kuznets Curve: Does One<br />
Size Fit All?”Ecological Economics 31: 409—423.<br />
46<br />
63
[47] List, John, and Shelby Gerking. 2000. “Regulatory Federalism and Environmental<br />
Protection in the United States.”Journal of Regional Sciences. 40: 453-471.<br />
[48] List, John, and Daniel Sturm. 2006. “How Elections Matter: Theory and Evidence<br />
from Environmental Policy.”Quarterly Journal of Economics. 121: 1249-1281.<br />
[49] Lockwood, Ben. 2002. “Distributive Politics and the Costs of Centralization.”Review<br />
of Economic Studies 69: 313—37.<br />
[50] – – . 2006. “The Political Economy of Decentralization.” In Handbook of Fiscal<br />
Federalism, edited by Ehtisham Ahmad and Giorgio Brosio, 33—60. Cheltenham:<br />
Edward Elgar.<br />
[51] Luechinger, Simon. 2009. “Valuing Air Quality Using the Life Satisfaction Approach.”Economic<br />
Journal 119(536): 482—515.<br />
[52] Nelson, Randy A, Tom Tietenberg, and Michael R Donihue. 1993. “Differential Environmental<br />
Regulation: Effects on Electric Utility Capital Turnover and Emissions.”<br />
Review of Economics and Statistics 75 (2): 368—73.<br />
[53] Oates, Wallace E. 1972. Fiscal Federalism. New York, NY: Harcourt Brace Jovanovich.<br />
[54] – – . 1999. “An Essay on Fiscal Federalism.” Journal of Economic Literature 37:<br />
1120—49.<br />
[55] Persson, Torsten, and Guido Tabellini. 2000. Political Economics: Explaining Economic<br />
Policy. Cambridge, MA: MIT Press.<br />
[56] Ponzetto, Giacomo A. M. 2011. “Heterogeneous Information and Trade Policy.”<br />
CEPR Discussion Paper No. 8726.<br />
[57] Poole, Keith T., and Howard Rosenthal. 1985. “A Spatial Model For Legislative Roll<br />
Call Analysis.”American Journal of Political Science 29(2): 357—84.<br />
[58] Putnam, Robert D. 1993. Making Democracy Work: Civic Traditions in Modern<br />
Italy. Princeton, NJ: Princeton University Press.<br />
[59] – – . 2000. Bowling Alone: The Collapse and Revival of American Community. New<br />
York, NY: Simon & Schuster.<br />
[60] Ryan, Stephen P. 2012. “The Costs of Environmental Regulation in a Concentrated<br />
Industry.”Econometrica 80(3): 1019—61.<br />
[61] Seabright, Paul. 1996. “Accountability and Decentralization in Government: An<br />
Incomplete Contracts Model.”European Economic Review 40: 61—89.<br />
[62] Snyder, James M., and David Strömberg. 2010. “Press Coverage and Political Accountability.”Journal<br />
of Political Economy 118(2): 335—408.<br />
[63] Strömberg, David. 2004. “Radio’s Impact on Public Spending.” Quarterly Journal<br />
of Economics 99: 189—221.<br />
47<br />
64
[64] Treisman, Daniel. 2007. “What Have We Learned About the Causes of Corruption<br />
From Ten Years of Cross-National Empirical Research?”Annual Review of Political<br />
Science 10: 211—44.<br />
[65] U.S. Department of Commerce. 1971. “Environmental Quality Control.” State and<br />
Local Governments Special Studies. U.S. Bureau of the Census.<br />
[66] U.S. Department of Commerce. 1980. “Environmental Quality Control.” State and<br />
Local Governments Special Studies. U.S. Bureau of the Census.<br />
[67] U.S. Senate. 1970. “Hearings of the subcommitte on air and water pollution of the<br />
Committe on Public Works.”U.S Government Printing Offi ce.<br />
[68] Wallis, John J. 2000. “American Government Finance in the Long Run: 1790 to<br />
1990.”Journal of Economic Perspectives, 14(1): 61-82.<br />
[69] – – . 2006. “The Concept of Systematic Corruption in American History” in Corruption<br />
and Reform: Lessons from America’s Economic History, edited by Edward<br />
L. Glaeser and Claudia Goldin. Cambridge, MA: National Bureau of Economic Research.<br />
[70] Wallis, John J., Price Fishback, and Shawn Kantor. 2006. “Politics, Relief, and Reform:<br />
Roosevelt’s Efforts to Control Corruption and Political Manipulation during<br />
the New Deal”, in Corruption and Reform: Lessons from America’s Economic History,<br />
edited by Edward L. Glaeser and Claudia Goldin. Cambridge, MA: National<br />
Bureau of Economic Research.<br />
48<br />
65
Table A1 —Information and the Effects of the CAA on SO 2 Emissions<br />
Dependent Variable: SO 2 Intensity of Income (log), 1960 to 1981<br />
(1) (2) (3) (4) (5) (6) (7)<br />
Newspaper Circ. -1.641 -0.155 -0.158 -0.092 0.430 -0.102 0.392<br />
× after 1970 (1.063) (0.925) (0.904) (0.975) (1.223) (0.884) (1.179)<br />
Newspaper Circ. 0.319* 0.389* 0.390* 0.424** 0.517** 0.357** 0.431***<br />
× t since 1970 (0.181) (0.204) (0.196) (0.205) (0.224) (0.154) (0.149)<br />
Income (log) -0.767 -0.535 -0.776 -0.337 -0.740 -0.198<br />
× after 1970 (0.542) (0.510) (0.554) (0.627) (0.530) (0.601)<br />
Income (log) -0.099 -0.130* -0.104 -0.018 -0.115** -0.048<br />
× t since 1970 (0.077) (0.077) (0.076) (0.098) (0.054) (0.058)<br />
Pop. Density (log) -0.048 -0.099 -0.046 -0.019 -0.039 -0.053<br />
× after 1970 (0.054) (0.060) (0.055) (0.071) (0.050) (0.067)<br />
Pop. Density (log) 0.010 0.017** 0.012 -0.001 0.005 -0.002<br />
× t since 1970 (0.008) (0.008) (0.008) (0.013) (0.006) (0.010)<br />
Polluting Mfg. % 3.278** 2.108*<br />
× after 1970 (1.256) (1.189)<br />
Polluting Mfg. % -0.441* 0.056<br />
× t since 1970 (0.231) (0.178)<br />
DW-Nominate 0.066 0.001<br />
× after 1970 (0.196) (0.174)<br />
DW-Nominate 0.036 -0.004<br />
× t since 1970 (0.038) (0.021)<br />
Midwest 0.428** 0.394**<br />
× after 1970 (0.185) (0.186)<br />
Midwest -0.022 0.007<br />
× t since 1970 (0.022) (0.020)<br />
South 0.600*** 0.553***<br />
× after 1970 (0.174) (0.165)<br />
South 0.029 0.038**<br />
× t since 1970 (0.026) (0.017)<br />
West 0.454* 0.410<br />
× after 1970 (0.245) (0.256)<br />
West -0.026 0.002<br />
× t since 1970 (0.040) (0.032)<br />
SO 2 Intensity (log) 0.080 0.032<br />
× after 1970 (0.057) (0.054)<br />
SO 2 Intensity (log) -0.049*** -0.050***<br />
× t since 1970 (0.006) (0.007)<br />
Observations 1056 1056 1056 1056 1056 1056 1056<br />
R 2 0.939 0.941 0.942 0.941 0.943 0.946 0.949<br />
Notes: Robust standard errors in parentheses, clustered by state; p = 10% * , 5% ** , 1% *** All regressions<br />
include time f.e., state f.e., and state-specific linear time trends. Independent variables are 1970 values.<br />
Polluting Manufacturing % is the share of value added represented by: Paper and allied products (SIC<br />
26), Chemicals and allied products (SIC 28), Petroleum and coal products (SIC 29), Stone, clay, glass,<br />
and concrete (SIC 32), Primary metal industries (SIC 33). The DW-Nominate score is the average for<br />
the state’s U.S. senators.<br />
58<br />
66
Table A2 —Information and the Effects of the CAA on NO x Emissions<br />
Dependent Variable: NO x Intensity of Income (log), 1960 to 1981<br />
(1) (2) (3) (4) (5) (6) (7)<br />
Newspaper Circ. 0.041 0.121 0.120 0.150 0.557 0.165 0.552<br />
× after 1970 (0.262) (0.356) (0.338) (0.368) (0.394) (0.348) (0.369)<br />
Newspaper Circ. 0.160** 0.190** 0.190** 0.187** 0.189* 0.164** 0.157**<br />
× t since 1970 (0.070) (0.087) (0.087) (0.088) (0.097) (0.063) (0.062)<br />
Income (log) 0.020 0.087 0.016 0.055 0.142 0.138<br />
× after 1970 (0.196) (0.194) (0.203) (0.252) (0.186) (0.254)<br />
Income (log) -0.005 -0.006 -0.004 -0.032 -0.078*** -0.081***<br />
× t since 1970 (0.031) (0.032) (0.030) (0.043) (0.022) (0.024)<br />
Pop. Density (log) -0.015 -0.030 -0.014 -0.009 -0.008 -0.013<br />
× after 1970 (0.019) (0.021) (0.021) (0.029) (0.020) (0.036)<br />
Pop. Density (log) -0.003 -0.003 -0.003 0.001 -0.008*** -0.008*<br />
× t since 1970 (0.004) (0.004) (0.004) (0.005) (0.002) (0.004)<br />
Polluting Mfg. % 0.939*** 0.640*<br />
× after 1970 (0.343) (0.337)<br />
Polluting Mfg. % -0.013 0.132<br />
× t since 1970 (0.089) (0.083)<br />
DW-Nominate 0.031 0.004<br />
× after 1970 (0.060) (0.065)<br />
DW-Nominate -0.004 -0.004<br />
× t since 1970 (0.015) (0.010)<br />
Midwest 0.010 -0.007<br />
× after 1970 (0.043) (0.040)<br />
Midwest 0.001 0.016*<br />
× t since 1970 (0.009) (0.009)<br />
South 0.115** 0.084<br />
× after 1970 (0.044) (0.053)<br />
South -0.006 0.014<br />
× t since 1970 (0.011) (0.010)<br />
West 0.105* 0.091<br />
× after 1970 (0.063) (0.063)<br />
West 0.013 0.018<br />
× t since 1970 (0.017) (0.013)<br />
NO x Intensity (log) 0.071** 0.042<br />
× after 1970 (0.027) (0.032)<br />
NO x Intensity (log) -0.043*** -0.050***<br />
× t since 1970 (0.009) (0.009)<br />
Observations 1056 1056 1056 1056 1056 1056 1056<br />
R 2 0.973 0.973 0.973 0.973 0.974 0.976 0.976<br />
Notes: Robust standard errors in parentheses, clustered by state; p = 10% * , 5% ** , 1% *** All regressions<br />
include time f.e., state f.e., and state-specific linear time trends. Independent variables are 1970 values.<br />
Polluting Manufacturing % is the share of value added represented by: Paper and allied products (SIC<br />
26), Chemicals and allied products (SIC 28), Petroleum and coal products (SIC 29), Stone, clay, glass,<br />
and concrete (SIC 32), Primary metal industries (SIC 33). The DW-Nominate score is the average for<br />
the state’s U.S. senators.<br />
59<br />
67
Table A3 —SO 2 Emissions: Alternative Controls for Economic Conditions<br />
Dependent Variable: SO 2 Intensity of Income (log), 1960 to 1981<br />
(1) (2) (3) (4) (5) (6) (7)<br />
Newspaper Circ. -0.158 -0.251 -0.164 -0.073 -0.183 -0.257 -0.264<br />
× after 1970 (0.904) (0.935) (0.962) (0.968) (0.964) (0.955) (0.967)<br />
Newspaper Circ. 0.390* 0.419** 0.389* 0.391* 0.458** 0.447** 0.486**<br />
× t since 1970 (0.196) (0.191) (0.200) (0.202) (0.200) (0.211) (0.201)<br />
Income (log) -0.535 -0.647 -0.756 -0.254 -0.205 -0.785 -0.710<br />
× after 1970 (0.510) (0.598) (0.595) (0.580) (0.584) (0.696) (0.799)<br />
Income (log) -0.130* -0.135 -0.098 -0.089 -0.119 0.073 -0.006<br />
× t since 1970 (0.077) (0.083) (0.072) (0.082) (0.078) (0.108) (0.089)<br />
Density (log) -0.099 -0.087 -0.047 -0.031 -0.045 -0.099 -0.162<br />
× after 1970 (0.060) (0.073) (0.056) (0.051) (0.055) (0.074) (0.097)<br />
Density (log) 0.017** 0.022** 0.011 0.011 0.019** 0.031** 0.034**<br />
× t since 1970 (0.008) (0.009) (0.008) (0.008) (0.008) (0.012) (0.015)<br />
Polluting Mfg. % 3.278** 1.598<br />
× after 1970 (1.256) (1.652)<br />
Polluting Mfg. % -0.441* -0.230<br />
× t since 1970 (0.231) (0.278)<br />
Manufacturing % 0.719 0.571<br />
× after 1970 (0.809) (0.968)<br />
Manufacturing % -0.217 0.024<br />
× t since 1970 (0.153) (0.183)<br />
Utilities % 0.952 -8.200<br />
× after 1970 (10.782) (11.314)<br />
Utilities % 0.057 -0.216<br />
× t since 1970 (2.053) (1.969)<br />
Fossil Fuels (log) 0.375*** 0.321** -0.200 -0.229<br />
× after 1970 (0.130) (0.125) (0.371) (0.450)<br />
Fossil Fuels (log) 0.007 0.040 0.183* 0.162*<br />
× t since 1970 (0.034) (0.028) (0.094) (0.087)<br />
Coal % 0.354 -0.004<br />
× after 1970 (0.279) (0.303)<br />
Coal % -0.215*** -0.181**<br />
× t since 1970 (0.040) (0.076)<br />
Motor Gas. % -3.280 -3.332<br />
× after 1970 (2.162) (2.584)<br />
Motor Gas. % 1.000* 0.660<br />
× t since 1970 (0.574) (0.578)<br />
Observations 1056 1056 1056 1056 1056 1056 1056<br />
R 2 0.942 0.941 0.940 0.942 0.944 0.943 0.945<br />
Notes: Robust standard errors in parentheses, clustered by state; p = 10% * , 5% ** , 1% *** All regressions<br />
include time f.e., state f.e., and state-specific linear time trends. All independent variables are 1970<br />
values. Manufacturing %, Polluting Manufacturing %, and Utilities % are shares of state GDP. Polluting<br />
manufacturing industries are: Paper and allied products (SIC 26), Chemicals and allied products (SIC<br />
28), Petroleum and coal products (SIC 29), Stone, clay, glass, and concrete (SIC 32), Primary metal<br />
industries (SIC 33). Fossil Fuels is the log of consumption relative to income. Coal % and Motor Gasoline<br />
% are shares of fossil-fuel consumption.<br />
60<br />
68
Table A4 —NO x Emissions: Alternative Controls for Economic Conditions<br />
Dependent Variable: NO x Intensity of Income (log), 1960 to 1981<br />
(1) (2) (3) (4) (5) (6) (7)<br />
Newspaper Circ. 0.120 0.102 0.163 0.139 0.130 0.161 0.237<br />
× after 1970 (0.338) (0.344) (0.347) (0.347) (0.353) (0.345) (0.320)<br />
Newspaper Circ. 0.190** 0.189** 0.189** 0.182** 0.187** 0.176** 0.182**<br />
× t since 1970 (0.087) (0.087) (0.084) (0.068) (0.073) (0.069) (0.068)<br />
Income (log) 0.087 0.044 -0.033 0.138 0.142 0.201 0.136<br />
× after 1970 (0.194) (0.203) (0.186) (0.201) (0.202) (0.200) (0.183)<br />
Income (log) -0.006 -0.003 -0.003 -0.056* -0.058* -0.073 -0.088**<br />
× t since 1970 (0.032) (0.032) (0.027) (0.030) (0.030) (0.044) (0.037)<br />
Density (log) -0.030 -0.023 -0.018 -0.011 -0.012 -0.003 -0.026<br />
× after 1970 (0.021) (0.025) (0.019) (0.019) (0.020) (0.024) (0.030)<br />
Density (log) -0.003 -0.004 -0.003 -0.005* -0.004 -0.007 -0.009*<br />
× t since 1970 (0.004) (0.004) (0.004) (0.003) (0.003) (0.005) (0.005)<br />
Polluting Mfg. % 0.939*** 0.961*<br />
× after 1970 (0.343) (0.497)<br />
Polluting Mfg. % -0.013 0.284**<br />
× t since 1970 (0.089) (0.120)<br />
Manufacturing % 0.140 0.020<br />
× after 1970 (0.254) (0.256)<br />
Manufacturing % 0.009 -0.054<br />
× t since 1970 (0.054) (0.054)<br />
Utilities % -4.499 -7.437*<br />
× after 1970 (3.438) (3.745)<br />
Utilities % 0.146 0.606<br />
× t since 1970 (0.696) (0.400)<br />
Fossil Fuels (log) 0.086*** 0.082** 0.154 0.126<br />
× after 1970 (0.032) (0.034) (0.104) (0.120)<br />
Fossil Fuels (log) -0.038*** -0.035*** -0.056 -0.075**<br />
× t since 1970 (0.012) (0.012) (0.036) (0.031)<br />
Coal % 0.029 -0.066<br />
× after 1970 (0.088) (0.111)<br />
Coal % -0.015 -0.032<br />
× t since 1970 (0.019) (0.025)<br />
Motor Gas. % 0.386 0.218<br />
× after 1970 (0.590) (0.666)<br />
Motor Gas. % -0.104 -0.146<br />
× t since 1970 (0.184) (0.165)<br />
Observations 1056 1056 1056 1056 1056 1056 1056<br />
R 2 0.973 0.973 0.973 0.975 0.975 0.975 0.976<br />
Notes: Robust standard errors in parentheses, clustered by state; p = 10% * , 5% ** , 1% *** All regressions<br />
include time f.e., state f.e., and state-specific linear time trends. All independent variables are 1970<br />
values. Manufacturing %, Polluting Manufacturing %, and Utilities % are shares of state GDP. Polluting<br />
manufacturing industries are: Paper and allied products (SIC 26), Chemicals and allied products (SIC<br />
28), Petroleum and coal products (SIC 29), Stone, clay, glass, and concrete (SIC 32), Primary metal<br />
industries (SIC 33). Fossil Fuels is the log of consumption relative to income. Coal % and Motor Gasoline<br />
% are shares of fossil-fuel consumption.<br />
61<br />
69
Table A5 —SO 2 Emissions: Alternative Controls for Political Conditions<br />
Dependent Variable: SO 2 Intensity of Income (log), 1960 to 1981<br />
(1) (2) (3) (4) (5) (6) (7)<br />
Newspaper Circ. -0.092 1.707* -0.132 0.320 0.272 -0.206 1.678<br />
× after 1970 (0.975) (0.988) (0.906) (0.897) (0.930) (0.977) (1.249)<br />
Newspaper Circ. 0.424** 0.484** 0.397* 0.375* 0.421* 0.381* 0.513**<br />
× t since 1970 (0.205) (0.234) (0.208) (0.216) (0.220) (0.198) (0.241)<br />
Income (log) -0.776 -0.188 -0.727 -0.502 -0.641 -0.830 -0.452<br />
× after 1970 (0.554) (0.473) (0.743) (0.588) (0.564) (0.540) (0.583)<br />
Income (log) -0.104 -0.069 -0.085 -0.106 -0.089 -0.068 -0.064<br />
× t since 1970 (0.076) (0.083) (0.083) (0.080) (0.080) (0.082) (0.093)<br />
Density (log) -0.046 -0.136*** -0.052 -0.062 -0.057 -0.047 -0.140***<br />
× after 1970 (0.055) (0.050) (0.054) (0.053) (0.053) (0.053) (0.051)<br />
Density (log) 0.012 0.006 0.009 0.011 0.010 0.011 0.008<br />
× t since 1970 (0.008) (0.009) (0.009) (0.008) (0.008) (0.008) (0.008)<br />
DW-Nominate 0.066 -0.311<br />
× after 1970 (0.196) (0.240)<br />
DW-Nominate 0.036 0.048<br />
× t since 1970 (0.038) (0.045)<br />
White Pop. % -2.741*** -3.789***<br />
× after 1970 (0.726) (1.175)<br />
White Pop. % -0.139 -0.065<br />
× t since 1970 (0.129) (0.148)<br />
% R. in Offi ce -0.038 0.416<br />
× after 1970 (0.281) (0.300)<br />
% R. in Offi ce -0.013 -0.041<br />
× t since 1970 (0.030) (0.033)<br />
% R. Votes -0.749* -0.434<br />
× after 1970 (0.410) (0.728)<br />
% R. Votes 0.022 0.294*<br />
× t since 1970 (0.103) (0.150)<br />
Elect. Evenness -0.586 0.721<br />
× after 1970 (0.420) (0.727)<br />
Elect. Evenness -0.043 -0.290<br />
× t since 1970 (0.134) (0.192)<br />
Sen. Class 1+3 0.047 -0.041<br />
× after 1970 (0.147) (0.122)<br />
Sen. Class 1+3 0.006 0.012<br />
× t since 1970 (0.022) (0.023)<br />
Sen. Class 2+3 -0.009 -0.126<br />
× after 1970 (0.115) (0.130)<br />
Sen. Class 2+3 0.034 0.036<br />
× t since 1970 (0.025) (0.024)<br />
Observations 1056 1056 1056 1056 1056 1056 1056<br />
R 2 0.941 0.943 0.941 0.941 0.942 0.941 0.945<br />
Notes: Robust standard errors in parentheses, clustered by state; p = 10% * , 5% ** , 1% *** All regressions<br />
include time f.e., state f.e., and state-specific linear time trends. All independent variables are 1970<br />
values. The DW-Nominate score is the average for the state’s U.S. senators. The share of Republicans<br />
in offi ce is computed considering the governor, the leaders of the two state legislatures, the two U.S.<br />
senators, and the majority of the state delegation to the U.S. House of Representatives. The share of<br />
Republican votes is the average in gubernatorial elections from 1968 to 1972. Election evenness is the<br />
average of 1− |% R. Votes −0.5| in gubernatorial elections from 1968 to 1972.<br />
62<br />
70
Table A6 —NO x Emissions: Alternative Controls for Political Conditions<br />
Dependent Variable: NO x Intensity of Income (log), 1960 to 1981<br />
(1) (2) (3) (4) (5) (6) (7)<br />
Newspaper Circ. 0.150 0.427 0.188 0.235 0.273 0.111 0.478<br />
× after 1970 (0.368) (0.365) (0.338) (0.341) (0.336) (0.364) (0.375)<br />
Newspaper Circ. 0.187** 0.188* 0.192** 0.217** 0.204** 0.173** 0.152*<br />
× t since 1970 (0.088) (0.102) (0.087) (0.095) (0.091) (0.076) (0.089)<br />
Income (log) 0.016 0.115 0.138 0.084 0.065 -0.006 0.156<br />
× after 1970 (0.203) (0.215) (0.215) (0.237) (0.215) (0.196) (0.241)<br />
Income (log) -0.004 -0.006 -0.002 0.010 -0.001 -0.017 -0.003<br />
× t since 1970 (0.030) (0.030) (0.030) (0.026) (0.034) (0.029) (0.026)<br />
Density (log) -0.014 -0.030 -0.026 -0.018 -0.018 -0.015 -0.030<br />
× after 1970 (0.021) (0.023) (0.021) (0.020) (0.020) (0.019) (0.022)<br />
Density (log) -0.003 -0.003 -0.003 -0.004 -0.003 -0.003 -0.002<br />
× t since 1970 (0.004) (0.004) (0.004) (0.003) (0.004) (0.004) (0.004)<br />
DW-Nominate 0.031 0.118*<br />
× after 1970 (0.060) (0.060)<br />
DW-Nominate -0.004 0.000<br />
× t since 1970 (0.015) (0.018)<br />
White Pop. % -0.451* -0.136<br />
× after 1970 (0.266) (0.283)<br />
White Pop. % 0.004 0.047<br />
× t since 1970 (0.048) (0.063)<br />
% R. in Offi ce -0.112* -0.140**<br />
× after 1970 (0.064) (0.069)<br />
% R. in Offi ce -0.003 -0.004<br />
× t since 1970 (0.010) (0.012)<br />
% R. Votes -0.181 0.108<br />
× after 1970 (0.167) (0.271)<br />
% R. Votes -0.043 -0.099<br />
× t since 1970 (0.042) (0.098)<br />
Elect. Evenness -0.210 -0.200<br />
× after 1970 (0.142) (0.264)<br />
Elect. Evenness -0.019 0.078<br />
× t since 1970 (0.041) (0.112)<br />
Sen. Class 1+3 0.009 0.009<br />
× after 1970 (0.041) (0.038)<br />
Sen. Class 1+3 0.015* 0.013<br />
× t since 1970 (0.009) (0.008)<br />
Sen. Class 2+3 -0.015 -0.016<br />
× after 1970 (0.032) (0.034)<br />
Sen. Class 2+3 0.004 0.004<br />
× t since 1970 (0.010) (0.009)<br />
Observations 1056 1056 1056 1056 1056 1056 1056<br />
R 2 0.973 0.973 0.973 0.973 0.973 0.973 0.974<br />
Notes: Robust standard errors in parentheses, clustered by state; p = 10% * , 5% ** , 1% *** All regressions<br />
include time f.e., state f.e., and state-specific linear time trends. All independent variables are 1970<br />
values. The DW-Nominate score is the average for the state’s U.S. senators. The share of Republicans<br />
in offi ce is computed considering the governor, the leaders of the two state legislatures, the two U.S.<br />
senators, and the majority of the state delegation to the U.S. House of Representatives. The share of<br />
Republican votes is the average in gubernatorial elections from 1968 to 1972. Election evenness is the<br />
average of 1− |% R. Votes −0.5| in gubernatorial elections from 1968 to 1972.<br />
63<br />
71
Table A7 —SO 2 Emissions: Alternative Dependent Variables<br />
SO 2 /cap. SO 2 /cap. SO 2 /sq.m. SO 2 /sq.m. SO 2 /$ SO 2 /$<br />
Income (log) at t -0.720* -0.690**<br />
(0.409) (0.325)<br />
Pop. Den. (log) at t -0.820 -0.525<br />
(1.146) (1.270)<br />
Newspaper Circ. -0.096 0.352 -0.048 0.402 -0.073 0.391<br />
× after 1970 (0.881) (1.146) (0.870) (1.133) (0.880) (1.154)<br />
Newspaper Circ. 0.392* 0.443*** 0.374* 0.449** 0.377* 0.442**<br />
× t since 1970 (0.206) (0.162) (0.211) (0.172) (0.206) (0.167)<br />
Income (log) -0.834 -0.221 -0.884* -0.294 -0.856 -0.252<br />
× after 1970 (0.528) (0.575) (0.513) (0.555) (0.511) (0.548)<br />
Income (log) -0.076 -0.035 -0.099 -0.066 -0.101 -0.055<br />
× t since 1970 (0.080) (0.062) (0.084) (0.071) (0.097) (0.095)<br />
Pop. Density (log) -0.066 -0.074 -0.062 -0.066 -0.058 -0.063<br />
× after 1970 (0.052) (0.064) (0.051) (0.061) (0.049) (0.062)<br />
Pop. Density (log) 0.007 -0.004 0.002 -0.009 0.004 -0.006<br />
× t since 1970 (0.008) (0.010) (0.009) (0.011) (0.009) (0.009)<br />
Polluting Mfg. % 1.948* 1.901 1.973<br />
× after 1970 (1.153) (1.144) (1.180)<br />
Polluting Mfg. % 0.108 0.122 0.099<br />
× t since 1970 (0.179) (0.180) (0.182)<br />
DW-Nominate 0.015 0.049 0.028<br />
× after 1970 (0.171) (0.168) (0.171)<br />
DW-Nominate -0.006 -0.004 -0.004<br />
× t since 1970 (0.022) (0.022) (0.022)<br />
Midwest 0.415** 0.414** 0.408**<br />
× after 1970 (0.182) (0.180) (0.181)<br />
Midwest 0.006 0.001 0.004<br />
× t since 1970 (0.021) (0.022) (0.021)<br />
South 0.559*** 0.547*** 0.551***<br />
× after 1970 (0.159) (0.158) (0.159)<br />
South 0.038** 0.035* 0.037*<br />
× t since 1970 (0.018) (0.019) (0.018)<br />
West 0.383 0.380 0.390<br />
× after 1970 (0.246) (0.241) (0.249)<br />
West 0.009 0.012 0.008<br />
× t since 1970 (0.032) (0.033) (0.034)<br />
SO 2 Intensity (log) 0.036 0.037 0.035<br />
× after 1970 (0.054) (0.053) (0.054)<br />
SO 2 Intensity (log) -0.050*** -0.050*** -0.050***<br />
× t since 1970 (0.007) (0.007) (0.007)<br />
Observations 1056 1056 1056 1056 1056 1056<br />
R 2<br />
Notes: Robust standard errors in parentheses, clustered by state; p = 10% * , 5% ** , 1% *** All regressions<br />
include time f.e., state f.e., and state-specific linear time trends. Dependent variables are logarithms.<br />
Independent variables interacted with the 1970 break are 1970 values. Polluting Manufacturing % is the<br />
share of value added represented by: Paper and allied products (SIC 26), Chemicals and allied products<br />
(SIC 28), Petroleum and coal products (SIC 29), Stone, clay, glass, and concrete (SIC 32), Primary metal<br />
industries (SIC 33). The DW-Nominate score is the average for the state’s U.S. senators.<br />
64<br />
72
Table A8 —NO x Emissions: Alternative Dependent Variables<br />
NO x /cap. NO x /cap. NO x /sq.m. NO x /sq.m. NO x /$ NO x /$<br />
Income (log) at t -1.101*** -1.007***<br />
(0.149) (0.144)<br />
Pop. Den. (log) at t -1.031*** -0.933***<br />
(0.334) (0.284)<br />
Newspaper Circ. 0.179 0.497 0.227 0.536* 0.235 0.533*<br />
× after 1970 (0.271) (0.329) (0.255) (0.314) (0.250) (0.315)<br />
Newspaper Circ. 0.193*** 0.179*** 0.175*** 0.189*** 0.175*** 0.188***<br />
× t since 1970 (0.071) (0.055) (0.058) (0.052) (0.055) (0.052)<br />
Income (log) -0.047 0.105 -0.097 0.020 -0.105 0.025<br />
× after 1970 (0.174) (0.228) (0.152) (0.203) (0.148) (0.205)<br />
Income (log) 0.017 -0.054** -0.006 -0.077*** -0.004 -0.075***<br />
× t since 1970 (0.025) (0.026) (0.019) (0.029) (0.022) (0.028)<br />
Pop. Density (log) -0.033* -0.037 -0.029* -0.032 -0.031* -0.032<br />
× after 1970 (0.017) (0.032) (0.015) (0.028) (0.015) (0.030)<br />
Pop. Density (log) -0.006* -0.008* -0.012*** -0.011** -0.012*** -0.011**<br />
× t since 1970 (0.003) (0.004) (0.003) (0.004) (0.003) (0.004)<br />
Polluting Mfg. % 0.547* 0.549** 0.548**<br />
× after 1970 (0.282) (0.272) (0.272)<br />
Polluting Mfg. % 0.142 0.137 0.137<br />
× t since 1970 (0.085) (0.085) (0.085)<br />
DW-Nominate 0.016 0.049 0.047<br />
× after 1970 (0.056) (0.050) (0.051)<br />
DW-Nominate -0.006 -0.003 -0.003<br />
× t since 1970 (0.009) (0.009) (0.009)<br />
Midwest 0.019 0.022 0.022<br />
× after 1970 (0.037) (0.034) (0.034)<br />
Midwest 0.011 0.003 0.004<br />
× t since 1970 (0.008) (0.008) (0.008)<br />
South 0.094** 0.087* 0.088*<br />
× after 1970 (0.046) (0.044) (0.044)<br />
South 0.008 0.003 0.003<br />
× t since 1970 (0.009) (0.009) (0.009)<br />
West 0.067 0.066 0.066<br />
× after 1970 (0.051) (0.046) (0.047)<br />
West 0.024* 0.026** 0.026**<br />
× t since 1970 (0.012) (0.012) (0.012)<br />
NO x Intensity (log) 0.033 0.020 0.020<br />
× after 1970 (0.028) (0.025) (0.026)<br />
NO x Intensity (log) -0.036*** -0.028*** -0.028**<br />
× t since 1970 (0.010) (0.010) (0.012)<br />
Observations 1056 1056 1056 1056 1056 1056<br />
R 2 0.971 0.973 0.995 0.996 0.977 0.979<br />
Notes: Robust standard errors in parentheses, clustered by state; p = 10% * , 5% ** , 1% *** All regressions<br />
include time f.e., state f.e., and state-specific linear time trends. Dependent variables are logarithms.<br />
Independent variables interacted with the 1970 break are 1970 values. Polluting Manufacturing % is the<br />
share of value added represented by: Paper and allied products (SIC 26), Chemicals and allied products<br />
(SIC 28), Petroleum and coal products (SIC 29), Stone, clay, glass, and concrete (SIC 32), Primary metal<br />
industries (SIC 33). The DW-Nominate score is the average for the state’s U.S. senators.<br />
65<br />
73
Table A9 —Channels of Pollution Abatement<br />
Income Pop. Den. Poll. % Mfg. % Util. % F. Fuel Coal % Gas. %<br />
Newspaper Circ. 0.059 0.048 0.020 0.022 0.011 -0.147 0.223 -0.017<br />
× after 1970 (0.158) (0.042) (0.014) (0.038) (0.007) (0.297) (0.151) (0.038)<br />
Newspaper Circ. 0.002 -0.018 0.000 -0.009 0.001 0.097* 0.041 -0.013<br />
× t since 1970 (0.023) (0.024) (0.005) (0.010) (0.002) (0.055) (0.025) (0.009)<br />
Income (log) -0.067 -0.050* -0.009 -0.018 0.003 0.216 -0.031 -0.035<br />
× after 1970 (0.047) (0.028) (0.007) (0.013) (0.003) (0.172) (0.096) (0.029)<br />
Income (log) 0.022** -0.023** 0.001 0.012*** -0.000 -0.008 0.001 0.003<br />
× t since 1970 (0.009) (0.010) (0.002) (0.004) (0.001) (0.019) (0.014) (0.004)<br />
Pop. Den. (log) -0.018*** 0.004 -0.000 -0.004*** 0.001*** -0.004 -0.015 0.004<br />
× after 1970 (0.005) (0.003) (0.001) (0.001) (0.000) (0.018) (0.010) (0.003)<br />
Pop. Den. (log) -0.003*** -0.005*** 0.000 0.000 0.000 -0.001 -0.003** 0.001**<br />
× t since 1970 (0.001) (0.001) (0.002) (0.001) (0.000)<br />
Observations 1056 1056 912 912 912 1056 1056 1056<br />
R 2 0.989 1.000 0.987 0.991 0.929 0.983 0.979 0.975<br />
Notes: Robust standard errors in parentheses, clustered by state; p = 10% * , 5% ** , 1% *** All regressions<br />
include time f.e., state f.e., and state-specific linear time trends. Independent variables interacted with<br />
the 1970 break are 1970 values. Income and Population Density are logarithms. Manufacturing %,<br />
Polluting Manufacturing %, and Utilities % are shares of state GDP. Polluting manufacturing industries<br />
are: Paper and allied products (SIC 26), Chemicals and allied products (SIC 28), Petroleum and coal<br />
products (SIC 29), Stone, clay, glass, and concrete (SIC 32), Primary metal industries (SIC 33). Fossil<br />
Fuels is the log of consumption relative to income. Coal % and Motor Gasoline % are shares of fossil-fuel<br />
consumption.<br />
66<br />
74
ad<br />
serie<br />
<strong>Ivie</strong><br />
Guardia Civil, 22 - Esc. 2, 1º<br />
46020 Valencia - Spain<br />
Phone: +34 963 190 050<br />
Fax: +34 963 190 055<br />
Website: www.ivie.es<br />
E-mail: publicaciones@ivie.es


