Hjertestatistik 2004 / Heart Statistics 2004 - Statens Institut for ...
Hjertestatistik 2004 / Heart Statistics 2004 - Statens Institut for ...
Hjertestatistik 2004 / Heart Statistics 2004 - Statens Institut for ...

Create successful ePaper yourself
Turn your PDF publications into a flip-book with our unique Google optimized e-Paper software.
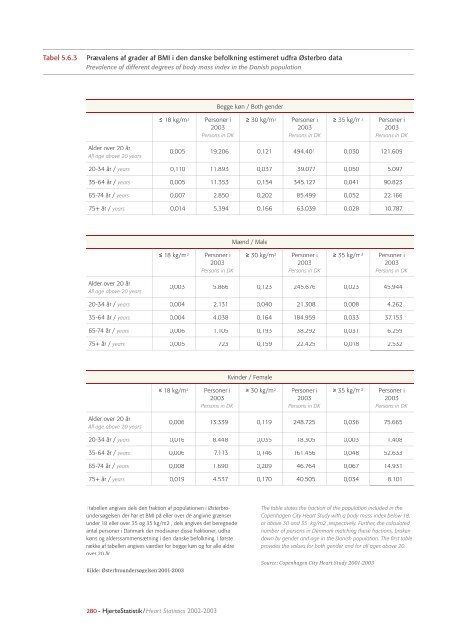
Tabel 5.6.3<br />
Prævalens af grader af BMI i den danske befolkning estimeret udfra Østerbro data<br />
Prevalence of different degrees of body mass index in the Danish population<br />
Alder over 20 år<br />
All age above 20 years<br />
I tabellen angives dels den fraktion af populationen i Østerbroundersøgelsen<br />
der har et BMI på eller over de angivne grænser<br />
under 18 eller over 35 og 35 kg/m2 , dels angives det beregnede<br />
antal personer i Danmark der modsvarer disse fraktioner, udfra<br />
køns og alderssammensætning i den danske befolkning. I første<br />
række af tabellen angives værdier <strong>for</strong> begge køn og <strong>for</strong> alle aldre<br />
over 20 år.<br />
Kilde: Østerbroundersøgelsen 2001-2003<br />
≤ 18 kg/m 2 Personer i<br />
2003<br />
Persons in DK<br />
280 - HjerteStatistik / <strong>Heart</strong> <strong>Statistics</strong> 2002-2003<br />
Begge køn / Both gender<br />
≥ 30 kg/m 2 Personer i<br />
2003<br />
Persons in DK<br />
≥ 35 kg/m 2 Personer i<br />
2003<br />
Persons in DK<br />
0,005 19.206 0,121 494.401 0,030 121.609<br />
20-34 år / years 0,110 11.893 0,037 39.077 0,050 5.097<br />
35-64 år / years 0,005 11.353 0,154 345.127 0,041 90.823<br />
65-74 år / years 0,007 2.850 0,202 85.499 0,052 22.166<br />
75+ år / years 0,014 5.394 0,166 63.039 0,028 10.787<br />
Alder over 20 år<br />
All age above 20 years<br />
≤ 18 kg/m 2 Personer i<br />
2003<br />
Persons in DK<br />
Mænd / Male<br />
≥ 30 kg/m 2 Personer i<br />
2003<br />
Persons in DK<br />
≥ 35 kg/m 2 Personer i<br />
2003<br />
Persons in DK<br />
0,003 5.866 0,123 245.676 0,023 45.944<br />
20-34 år / years 0,004 2.131 0,040 21.308 0,008 4.262<br />
35-64 år / years 0,004 4.038 0,164 184.959 0,033 37.153<br />
65-74 år / years 0,006 1.105 0,193 38.292 0,031 6.259<br />
75+ år / years 0,005 723 0,159 22.425 0,018 2.532<br />
Alder over 20 år<br />
All age above 20 years<br />
≤ 18 kg/m 2 Personer i<br />
2003<br />
Persons in DK<br />
Kvinder / Female<br />
≥ 30 kg/m 2 Personer i<br />
2003<br />
Persons in DK<br />
≥ 35 kg/m 2 Personer i<br />
2003<br />
Persons in DK<br />
0,006 13.339 0,119 248.725 0,036 75.665<br />
20-34 år / years 0,016 8.448 0,035 18.305 0,003 1.408<br />
35-64 år / years 0,006 7.113 0,146 161.456 0,048 52.633<br />
65-74 år / years 0,008 1.690 0,209 46.764 0,067 14.931<br />
75+ år / years 0,019 4.537 0,170 40.505 0,034 8.101<br />
The table states the fraction of the population included in the<br />
Copenhagen City <strong>Heart</strong> Study with a body mass index below 18,<br />
or above 30 and 35 kg/m2 ,respectively. Further, the calculated<br />
number of persons in Denmark matching these fractions, broken<br />
down by gender and age in the Danish population. The fi rst table<br />
provides the values <strong>for</strong> both gender and <strong>for</strong> all ages above 20.<br />
Source: Copenhagen City <strong>Heart</strong> Study 2001-2003