


Create successful ePaper yourself
Turn your PDF publications into a flip-book with our unique Google optimized e-Paper software.
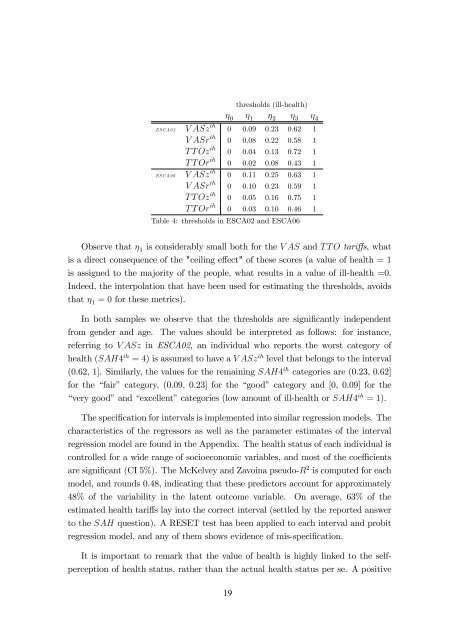
thresholds (ill-health)<br />
0 1 2 3 4<br />
ESCA02 V ASz ih 0 0.09 0.23 0.62 1<br />
V ASr ih 0 0.08 0.22 0.58 1<br />
T T Oz ih 0 0.04 0.13 0.72 1<br />
T T Or ih 0 0.02 0.08 0.43 1<br />
ESCA06 V ASz ih 0 0.11 0.25 0.63 1<br />
V ASr ih 0 0.10 0.23 0.59 1<br />
T T Oz ih 0 0.05 0.16 0.75 1<br />
T T Or ih 0 0.03 0.10 0.46 1<br />
Table 4: thresholds in ESCA02 and ESCA06<br />
Observe that 1 is considerably small both for the V AS and T T O tari¤s, what<br />
is a direct consequence <strong>of</strong> the "ceiling e¤ect" <strong>of</strong> these scores (a value <strong>of</strong> health = 1<br />
is assigned <strong>to</strong> the majority <strong>of</strong> the people, what results in a value <strong>of</strong> ill-health =0.<br />
Indeed, the interpolation that have been used for estimating the thresholds, avoids<br />
that 1 = 0 for these metrics).<br />
In both samples we observe that the thresholds are signi…cantly independent<br />
from gender and age. The values should be interpreted as follows: for instance,<br />
referring <strong>to</strong> V ASz in ESCA02, an individual who reports the worst category <strong>of</strong><br />
health (SAH4 ih = 4) is assumed <strong>to</strong> have a V ASz ih level that belongs <strong>to</strong> the interval<br />
(0.62, 1]. Similarly, the values for the remaining SAH4 ih categories are (0.23, 0.62]<br />
for the “fair” category, (0.09, 0.23] for the “good” category and [0, 0.09] for the<br />
“very good”and “excellent”categories (low amount <strong>of</strong> ill-health or SAH4 ih = 1).<br />
The speci…cation for intervals is implemented in<strong>to</strong> similar regression models. The<br />
characteristics <strong>of</strong> the regressors as well as the parameter estimates <strong>of</strong> the interval<br />
regression model are found in the Appendix. The health status <strong>of</strong> each individual is<br />
controlled for a wide range <strong>of</strong> socioeconomic variables, and most <strong>of</strong> the coe¢ cients<br />
are signi…cant (CI 5%). The McKelvey and Zavoina pseudo-R 2 is computed for each<br />
model, and rounds 0.48, indicating that these predic<strong>to</strong>rs account for approximately<br />
48% <strong>of</strong> the variability in the latent outcome variable. On average, 63% <strong>of</strong> the<br />
estimated health tari¤s lay in<strong>to</strong> the correct interval (settled by the reported answer<br />
<strong>to</strong> the SAH question). A RESET test has been applied <strong>to</strong> each interval and probit<br />
regression model, and any <strong>of</strong> them shows evidence <strong>of</strong> mis-speci…cation.<br />
It is important <strong>to</strong> remark that the value <strong>of</strong> health is highly linked <strong>to</strong> the selfperception<br />
<strong>of</strong> health status, rather than the actual health status per se. A positive<br />
17


