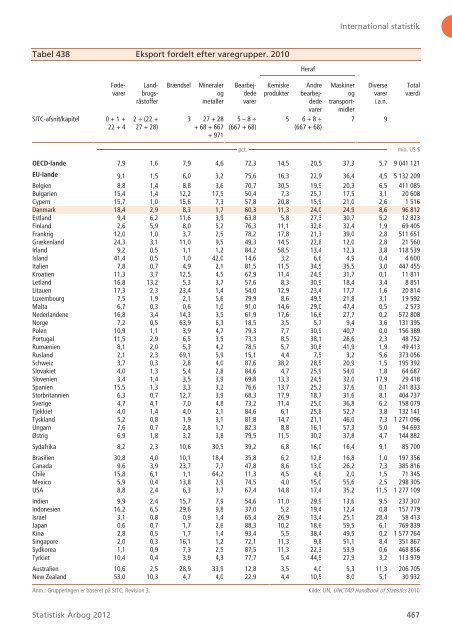
International statistik Tabel 438 Eksport fordelt efter varegrupper. 2010 Heraf Fødevarer Landbrugsråstoffer Brændsel Mineraler og metaller Bearbejdede varer Kemiske produkter Andre bearbejdede varer Maskiner og transportmidler Diverse varer i.a.n. Total værdi SITC-afsnit/kapitel 0 + 1 + 22 + 4 2 ÷ (22 + 27 + 28) 3 27 + 28 + 68 + 667 + 971 5 – 8 ÷ (667 + 68) 5 6 + 8 ÷ (667 + 68) 7 9 pct. mio. US $ OECD-lande 7,9 1,6 7,9 4,6 72,3 14,5 20,5 37,3 5,7 9 041 121 EU-lande 9,1 1,5 6,0 3,2 75,6 16,3 22,9 36,4 4,5 5 132 209 Belgien 8,8 1,4 8,8 3,6 70,7 30,5 19,9 20,3 6,5 411 085 Bulgarien 15,4 1,4 12,2 17,5 50,4 7,3 25,7 17,5 3,1 20 608 Cypern 15,7 1,0 15,6 7,3 57,8 20,8 15,9 21,0 2,6 1 516 Danmark 18,4 2,9 8,3 1,7 60,3 11,3 24,0 24,9 8,6 96 812 Estland 9,4 6,2 11,6 3,9 63,8 5,8 27,3 30,7 5,2 12 823 Finland 2,6 5,9 8,0 5,2 76,3 11,1 32,8 32,4 1,9 69 405 Frankrig 12,0 1,0 3,7 2,5 78,2 17,8 21,3 39,0 2,8 511 651 Grækenland 24,3 3,1 11,0 9,5 49,3 14,5 22,8 12,0 2,8 21 560 Irland 9,2 0,5 1,1 1,2 84,2 58,5 13,4 12,3 3,8 118 539 Island 41,4 0,5 1,0 42,0 14,6 3,2 6,6 4,9 0,4 4 600 Italien 7,8 0,7 4,9 2,1 81,5 11,5 34,5 35,5 3,0 447 455 Kroatien 11,3 3,7 12,5 4,5 67,9 11,4 24,9 31,7 0,1 11 811 Letland 16,8 13,2 5,3 3,7 57,6 8,3 30,9 18,4 3,4 8 851 Litauen 17,3 2,3 23,4 1,4 54,0 12,9 23,4 17,7 1,6 20 814 Luxembourg 7,5 1,9 2,1 5,6 79,9 8,6 49,5 21,8 3,1 19 592 Malta 6,7 0,3 0,6 1,0 91,0 14,6 29,0 47,4 0,5 2 573 Nederlandene 16,8 3,4 14,3 3,5 61,9 17,6 16,6 27,7 0,2 572 808 Norge 7,2 0,5 63,9 6,3 18,5 3,5 5,7 9,4 3,6 131 395 Polen 10,9 1,1 3,9 4,7 79,3 7,7 30,9 40,7 0,0 156 389 Portugal 11,5 2,9 6,5 3,5 73,3 8,5 38,1 26,6 2,3 48 752 Rumænien 8,1 2,0 5,3 4,2 78,5 5,7 30,8 41,9 1,9 49 413 Rusland 2,1 2,3 69,1 5,9 15,1 4,4 7,5 3,2 5,6 373 056 Schweiz 3,7 0,3 2,8 4,0 87,6 38,2 28,5 20,9 1,5 195 392 Slovakiet 4,0 1,3 5,4 2,8 84,6 4,7 25,9 54,0 1,8 64 687 Slovenien 3,4 1,4 3,5 3,9 69,8 13,3 24,5 32,0 17,9 29 418 Spanien 15,5 1,3 3,3 3,2 76,6 13,7 25,2 37,6 0,1 241 833 Storbritannien 6,3 0,7 12,7 3,9 68,3 17,9 18,7 31,6 8,1 404 737 Sverige 4,7 4,1 7,0 4,8 73,2 11,4 25,0 36,8 6,2 158 079 Tjekkiet 4,0 1,4 4,0 2,1 84,6 6,1 25,8 52,7 3,8 132 141 Tyskland 5,2 0,8 1,9 3,1 81,8 14,7 21,1 46,0 7,3 1 271 096 Ungarn 7,6 0,7 2,8 1,7 82,3 8,8 16,1 57,3 5,0 94 693 Østrig 6,9 1,8 3,2 3,8 79,5 11,5 30,2 37,8 4,7 144 882 Sydafrika 8,2 2,3 10,6 30,5 39,2 6,8 16,0 16,4 9,1 85 700 Brasilien 30,8 4,0 10,1 18,4 35,8 6,2 12,8 16,8 1,0 197 356 Canada 9,6 3,9 23,7 7,7 47,8 8,6 13,0 26,2 7,3 385 816 Chile 15,8 6,1 1,1 64,2 11,3 4,5 4,8 2,0 1,5 71 345 Mexico 5,9 0,4 13,8 2,9 74,5 4,0 15,0 55,6 2,5 298 305 USA 8,8 2,4 6,3 3,7 67,4 14,8 17,4 35,2 11,5 1 277 109 Indien 9,9 2,4 15,7 7,9 54,6 11,0 29,9 13,6 9,5 237 307 Indonesien 16,2 6,5 29,6 9,8 37,0 5,2 19,4 12,4 0,8 157 779 Israel 3,1 0,8 0,9 1,4 65,4 26,9 13,4 25,1 28,4 58 413 Japan 0,6 0,7 1,7 2,6 88,3 10,2 18,6 59,5 6,1 769 839 Kina 2,8 0,5 1,7 1,4 93,4 5,5 38,4 49,5 0,2 1 577 764 Singapore 2,0 0,3 16,1 1,2 72,1 11,3 9,8 51,1 8,4 351 867 Sydkorea 1,1 0,9 7,3 2,5 87,5 11,3 22,3 53,9 0,6 468 856 Tyrkiet 10,4 0,4 3,9 4,3 77,7 5,4 44,5 27,9 3,2 113 979 Australien 10,6 2,5 28,9 33,9 12,8 3,5 4,0 5,3 11,3 206 705 New Zealand 53,0 10,3 4,7 4,0 22,9 4,4 10,5 8,0 5,1 30 932 Anm.: Grupperingen er baseret på SITC, Revision 3. Kilde: UN, UNCTAD Handbook of Statistics 2010 Statistisk Årbog <strong>2012</strong> 467
International statistik Tabel 439 Betalingsbalancens løbende poster for forskellige lande. 2010 Eksport fob (a) Import fob (b) Varer, netto (a – b) Tjenester, netto Løn- og formueindkomst, netto Løbende overførsler, netto Løbende poster i alt, netto Løbende poster i pct. af BNP Nettotilgodehavender over for udlandet ultimo mio. U.S. $ pct. mio. U.S. OECD-lande 8 832 533 9 368 324 -535 780 376 637 . . . . . . -270 672 . . . . . . EU-lande (27) 1 811 870 1 979 162 -167 292 116 933 401 -88 373 -138 331 -0,9 . . . Belgien 279 701 284 431 -4 730 8 544 10 958 -8 423 6 349 1,4 361 672 Bulgarien 20 608 23 826 -3 217 2 438 -1 835 2 036 -578 -1,2 -47 701 Cypern 1 518 8 032 -6 514 5 023 -1 267 -45 -2 803 -12,1 -4 047 Danmark 96 044 87 348 8 696 8 302 4 979 -5 766 16 210 5,2 29 880 Estland 11 641 11 972 -331 1 729 -1 067 341 673 3,5 -13 917 Finland 70 132 66 186 3 947 197 2 523 -2 207 4 459 1,9 22 003 Frankrig 517 150 588 360 -71 210 12 760 48 892 -34 941 -44 499 -1,7 -272 930 Grækenland 22 628 60 166 -37 537 17 278 -12 195 118 -32 335 -10,6 -282 171 Irland 109 856 61 583 48 274 -9 437 -36 293 -1 589 954 0,5 -200 660 Island 4 603 3 620 983 281 -2 610 -70 -1 417 -11,3 -84 077 Italien 448 374 475 652 -27 278 -11 911 -10 649 -21 392 -71 229 -3,5 -507 916 Kroatien 12 067 19 944 -7 877 7 569 -2 046 1 454 -901 -1,5 -56 799 Letland 9 107 10 799 -1 691 1 466 85 871 731 3,0 -19 279 Litauen 20 816 22 376 -1 560 1 295 -903 1 834 667 1,8 -20 577 Luxembourg 16 662 22 105 -5 443 30 089 -19 625 -900 4 122 7,5 51 549 Malta 3 088 4 317 -1 229 1 363 -586 37 -415 -5,1 607 Nederlandene 480 296 428 419 51 877 10 692 3 570 -14 504 51 635 6,6 212 543 Norge 132 691 74 300 58 391 -3 108 872 -4 711 51 444 12,5 405 593 Polen 162 267 173 681 -11 414 3 493 -16 703 3 642 -20 982 -4,5 -305 731 Portugal 48 905 73 016 -24 111 8 825 -10 423 2 858 -22 851 -10,0 -250 064 Rumænien 49 411 57 216 -7 805 -836 -2 361 4 522 -6 480 -4,0 -105 757 Rusland 400 419 248 738 151 681 -29 211 -48 617 -3 600 70 253 4,8 15 685 Schweiz 258 521 246 229 12 292 44 020 32 854 -12 263 76 901 14,7 773 204 Slovakiet 64 665 64 484 182 -988 -1 658 -544 -3 009 -3,5 -59 005 Slovenien 24 359 25 961 -1 602 1 730 -662 146 -388 -0,8 -17 209 Spanien 252 974 315 323 -62 349 36 500 -28 986 -9 508 -64 343 -4,6 -1 262 210 Storbritannien 410 223 563 150 -152 927 69 611 42 482 -30 769 -71 604 -3,2 -312 420 Sverige 160 408 149 514 10 894 17 937 7 781 -6 204 30 408 6,6 -76 019 Tjekkiet 126 414 123 600 2 814 3 444 -13 357 -90 -7 188 -3,7 -99 815 Tyskland 1 303 330 1 098 610 204 720 -25 631 59 648 -50 792 187 943 5,7 1 252 350 Ungarn 93 294 87 082 6 212 3 178 -6 837 497 3 049 2,3 -143 111 Østrig 147 710 151 993 -4 283 17 665 737 -2 658 11 461 3,0 -40 123 Sydafrika 85 700 81 862 3 838 -4 453 -7 224 -2 278 -10 117 -2,8 -64 896 Brasilien 201 915 181 694 20 221 -30 807 -39 567 2 788 -47 365 -2,3 -677 403 Canada 393 183 401 865 -8 682 -22 089 -15 968 -2 569 -49 307 -3,1 -195 959 Chile 71 028 55 174 15 855 -1 019 -15 424 4 390 3 802 1,9 -10 026 Mexico 298 860 301 940 -3 080 -10 200 -13 889 21 504 -5 665 -0,6 -362 732 USA 1 293 220 1 935 580 -642 360 142 328 165 224 -136 095 -470 902 -3,2 -2 470 990 Indien 225 502 323 435 -97 933 6 920 -12 926 52 158 -51 781 -3,0 -223 048 Indonesien 158 074 127 447 30 627 -9 324 -20 291 4 630 5 643 0,8 -289 265 Israel 55 674 58 039 -2 365 6 648 -6 312 8 426 6 396 2,9 987 Japan 730 076 639 103 90 973 -16 114 133 291 -12 395 195 755 3,6 3 087 700 Kina 1 581 420 1 327 240 254 180 -22 118 30 380 42 932 305 374 5,4 1 790 650 Singapore 358 485 311 727 46 758 15 845 -8 230 -4 815 49 558 22,3 528 837 Sydkorea 464 300 422 425 41 875 -11 201 768 -3 229 28 214 2,8 -136 833 Tyrkiet 120 902 177 347 -56 445 14 699 -7 322 1 329 -47 739 -6,5 -357 142 Australien 212 850 194 670 18 180 -2 980 -45 803 -1 388 -31 991 -2,6 -794 884 New Zealand 31 883 29 539 2 344 -310 -6 999 -29 -4 994 -3,5 -113 588 Kilde: IMF: Balance of Payments Statistics, January <strong>2012</strong> (CD-rom. Stats.oecd.org. Epp.eurostat.eu.) 468 Statistisk Årbog <strong>2012</strong>
- Page 1 and 2:
STATISTISK ÅRBOG 2012
- Page 3 and 4:
Indledning Statistisk Årbog 2012 U
- Page 5 and 6:
Indledning Indholdsfortegnelse Danm
- Page 7 and 8:
Indledning Signaturforklaring - Nul
- Page 9 and 10:
Indledning Danmark 8 Statistisk År
- Page 11 and 12:
Geografi og klima 2 Klima Det regne
- Page 13 and 14:
Geografi og klima Tabel 2 Danmarks
- Page 15 and 16:
Geografi og klima Tabel 4 Arealdæk
- Page 17 and 18:
Geografi og klima Tabel 6 Meteorolo
- Page 19 and 20:
Befolkning og valg Stigningen i gen
- Page 21 and 22:
Befolkning og valg Figur 6 Indvandr
- Page 23 and 24:
Befolkning og valg Danskerne lever
- Page 25 and 26:
Befolkning og valg Figur 12 Skilsmi
- Page 27 and 28:
Befolkning og valg valg. I 00’ern
- Page 29 and 30:
Befolkning og valg Tabel 9 Folketal
- Page 31 and 32:
Befolkning og valg Tabel 11 Folketa
- Page 33 and 34:
Befolkning og valg Tabel 12 (side 2
- Page 35 and 36:
Befolkning og valg Tabel 15 Indvand
- Page 37 and 38:
Befolkning og valg Tabel 17 Persone
- Page 39 and 40:
Befolkning og valg Tabel 21 Ind- og
- Page 41 and 42:
Befolkning og valg Tabel 24 Gennems
- Page 43 and 44:
Befolkning og valg Tabel 30 Dødeli
- Page 45 and 46:
Befolkning og valg Tabel 32 Kvinder
- Page 47 and 48:
Befolkning og valg Tabel 35 Middell
- Page 49 and 50:
Befolkning og valg Tabel 39 Børn.
- Page 51 and 52:
Befolkning og valg Tabel 43 Skilsmi
- Page 53 and 54:
Befolkning og valg Tabel 47 De hypp
- Page 55 and 56:
Befolkning og valg Tabel 49 Valgte
- Page 57 and 58:
Befolkning og valg Tabel 50 (side 2
- Page 59 and 60:
Befolkning og valg Tabel 52 Regions
- Page 61 and 62:
Befolkning og valg Tabel 55 Kommuna
- Page 63 and 64:
Befolkning og valg Tabel 59 Folkeaf
- Page 65 and 66:
Uddannelse 2 Ordinære uddannelser
- Page 67 and 68:
Uddannelse I skoleåret 2009-10 afs
- Page 69 and 70:
Uddannelse Flest mellemlange uddann
- Page 71 and 72:
Uddannelse Tabel 61 Uddannelsesinst
- Page 73 and 74:
Uddannelse Tabel 66 Elever ved vide
- Page 75 and 76:
Uddannelse Tabel 69 Befolkningens h
- Page 77 and 78:
Uddannelse Tabel 73 Kursusdeltagere
- Page 79 and 80:
Kultur og kirke Figur 2 Folkebiblio
- Page 81 and 82:
Kultur og kirke Fodbold er Danmarks
- Page 83 and 84:
Kultur og kirke Tabel 74 Rigsarkive
- Page 85 and 86:
Kultur og kirke Tabel 77 Folkebibli
- Page 87 and 88:
Kultur og kirke Tabel 81 De 20 stø
- Page 89 and 90:
Kultur og kirke Tabel 86 Biografer
- Page 91 and 92:
Kultur og kirke Tabel 91 Husstanden
- Page 93 and 94:
Kultur og kirke Tabel 94 Salg af mu
- Page 95 and 96:
Kultur og kirke Tabel 97 Tilskuerta
- Page 97 and 98:
Kultur og kirke Tabel 102 Folkekirk
- Page 99 and 100:
Arbejdsmarked og løn Den stigende
- Page 101 and 102:
Arbejdsmarked og løn Lidt færre m
- Page 103 and 104:
Arbejdsmarked og løn Figur 10 Ledi
- Page 105 and 106:
Arbejdsmarked og løn Figur 14 Besk
- Page 107 and 108:
Arbejdsmarked og løn 5 Pendling L
- Page 109 and 110:
Arbejdsmarked og løn Figur 19 Besk
- Page 111 and 112:
Arbejdsmarked og løn Den højeste
- Page 113 and 114:
Arbejdsmarked og løn Tabel 107 Bes
- Page 115 and 116:
Arbejdsmarked og løn Tabel 110 Bef
- Page 117 and 118:
Arbejdsmarked og løn Tabel 113 Ind
- Page 119 and 120:
Arbejdsmarked og løn Tabel 116 Lø
- Page 121 and 122:
Arbejdsmarked og løn Tabel 118 Lø
- Page 123 and 124:
Arbejdsmarked og løn Tabel 121 Uge
- Page 125 and 126:
Arbejdsmarked og løn Tabel 126 Bru
- Page 127 and 128:
Arbejdsmarked og løn Tabel 129 Udb
- Page 129 and 130:
Arbejdsmarked og løn Tabel 132 Off
- Page 131 and 132:
Arbejdsmarked og løn Tabel 134 For
- Page 133 and 134:
Sociale forhold, sundhed og retsvæ
- Page 135 and 136:
Sociale forhold, sundhed og retsvæ
- Page 137 and 138:
Sociale forhold, sundhed og retsvæ
- Page 139 and 140:
Sociale forhold, sundhed og retsvæ
- Page 141 and 142:
Sociale forhold, sundhed og retsvæ
- Page 143 and 144:
Sociale forhold, sundhed og retsvæ
- Page 145 and 146:
Sociale forhold, sundhed og retsvæ
- Page 147 and 148:
Sociale forhold, sundhed og retsvæ
- Page 149 and 150:
Sociale forhold, sundhed og retsvæ
- Page 151 and 152:
Sociale forhold, sundhed og retsvæ
- Page 153 and 154:
Sociale forhold, sundhed og retsvæ
- Page 155 and 156:
Sociale forhold, sundhed og retsvæ
- Page 157 and 158:
Sociale forhold, sundhed og retsvæ
- Page 159 and 160:
Sociale forhold, sundhed og retsvæ
- Page 161 and 162:
Sociale forhold, sundhed og retsvæ
- Page 163 and 164:
Sociale forhold, sundhed og retsvæ
- Page 165 and 166:
Sociale forhold, sundhed og retsvæ
- Page 167 and 168:
Sociale forhold, sundhed og retsvæ
- Page 169 and 170:
Sociale forhold, sundhed og retsvæ
- Page 171 and 172:
Sociale forhold, sundhed og retsvæ
- Page 173 and 174:
Sociale forhold, sundhed og retsvæ
- Page 175 and 176:
Sociale forhold, sundhed og retsvæ
- Page 177 and 178:
Sociale forhold, sundhed og retsvæ
- Page 179 and 180:
Sociale forhold, sundhed og retsvæ
- Page 181 and 182:
Sociale forhold, sundhed og retsvæ
- Page 183 and 184:
Sociale forhold, sundhed og retsvæ
- Page 185 and 186:
Sociale forhold, sundhed og retsvæ
- Page 187 and 188:
Sociale forhold, sundhed og retsvæ
- Page 189 and 190:
Sociale forhold, sundhed og retsvæ
- Page 191 and 192:
Indkomst, forbrug og priser Figur 2
- Page 193 and 194:
Indkomst, forbrug og priser Hvis gi
- Page 195 and 196:
Indkomst, forbrug og priser Figur 8
- Page 197 and 198:
Indkomst, forbrug og priser Figur 1
- Page 199 and 200:
Indkomst, forbrug og priser Prisind
- Page 201 and 202:
Indkomst, forbrug og priser Figur 1
- Page 203 and 204:
Indkomst, forbrug og priser Tabel 2
- Page 205 and 206:
Indkomst, forbrug og priser Tabel 2
- Page 207 and 208:
Indkomst, forbrug og priser Tabel 2
- Page 209 and 210:
Indkomst, forbrug og priser Tabel 2
- Page 211 and 212:
Indkomst, forbrug og priser Tabel 2
- Page 213 and 214:
Indkomst, forbrug og priser Tabel 2
- Page 215 and 216:
Indkomst, forbrug og priser Tabel 2
- Page 217 and 218:
Indkomst, forbrug og priser Tabel 2
- Page 219 and 220:
Indkomst, forbrug og priser Tabel 2
- Page 221 and 222:
Indkomst, forbrug og priser Tabel 2
- Page 223 and 224:
Indkomst, forbrug og priser Tabel 2
- Page 225 and 226:
Indkomst, forbrug og priser Tabel 2
- Page 227 and 228:
Generel erhvervsstatistik Et arbejd
- Page 229 and 230:
Generel erhvervsstatistik 74 pct. a
- Page 231 and 232:
Generel erhvervsstatistik Figur 8 A
- Page 233 and 234:
Generel erhvervsstatistik 47 pct. a
- Page 235 and 236:
Generel erhvervsstatistik Tabel 233
- Page 237 and 238:
Generel erhvervsstatistik Tabel 237
- Page 239 and 240:
Generel erhvervsstatistik Tabel 238
- Page 241 and 242:
Generel erhvervsstatistik Tabel 242
- Page 243 and 244:
Landbrug, skovbrug og fiskeri Landb
- Page 245 and 246:
Landbrug, skovbrug og fiskeri Figur
- Page 247 and 248:
Landbrug, skovbrug og fiskeri Inves
- Page 249 and 250:
Landbrug, skovbrug og fiskeri Figur
- Page 251 and 252:
Landbrug, skovbrug og fiskeri Tabel
- Page 253 and 254:
Landbrug, skovbrug og fiskeri Tabel
- Page 255 and 256:
Landbrug, skovbrug og fiskeri Tabel
- Page 257 and 258:
Landbrug, skovbrug og fiskeri Tabel
- Page 259 and 260:
Landbrug, skovbrug og fiskeri Tabel
- Page 261 and 262:
Landbrug, skovbrug og fiskeri Tabel
- Page 263 and 264:
Landbrug, skovbrug og fiskeri Tabel
- Page 265 and 266:
Landbrug, skovbrug og fiskeri Tabel
- Page 267 and 268:
Industri Finanskrisen betød fald i
- Page 269 and 270:
Industri 5 Koncentrationsgraden på
- Page 271 and 272:
Industri Tabel 273 Produktionsindek
- Page 273 and 274:
Industri 272 Statistisk Årbog 2012
- Page 275 and 276:
Byggeri og boligforhold 2 Opvarmnin
- Page 277 and 278:
Byggeri og boligforhold Flest kvadr
- Page 279 and 280:
Byggeri og boligforhold Figur 6 Bes
- Page 281 and 282:
Byggeri og boligforhold Tabel 276 B
- Page 283 and 284:
Byggeri og boligforhold Tabel 278 B
- Page 285 and 286:
Byggeri og boligforhold Tabel 282 B
- Page 287 and 288:
Byggeri og boligforhold Tabel 285 B
- Page 289 and 290:
Byggeri og boligforhold Tabel 289 U
- Page 291 and 292:
Serviceerhverv og informationssamfu
- Page 293 and 294:
Serviceerhverv og informationssamfu
- Page 295 and 296:
Serviceerhverv og informationssamfu
- Page 297 and 298:
Serviceerhverv og informationssamfu
- Page 299 and 300:
Serviceerhverv og informationssamfu
- Page 301 and 302:
Serviceerhverv og informationssamfu
- Page 303 and 304:
Transport Den søværts godsomsætn
- Page 305 and 306:
Transport Færre lokomotiver, flere
- Page 307 and 308:
Transport Markant flere med indenri
- Page 309 and 310:
Transport Figur 11 Containeromsætn
- Page 311 and 312:
Transport Tabel 301 Transportens in
- Page 313 and 314:
Transport Tabel 305 Vare- og lastbi
- Page 315 and 316:
Transport Tabel 309 Trafik på veje
- Page 317 and 318:
Transport Tabel 311 Godstransport m
- Page 319 and 320:
Transport Tabel 314 De 20 mest solg
- Page 321 and 322:
Transport Tabel 318 Biltrafik på d
- Page 323 and 324:
Transport Tabel 321 Alvorligt tilsk
- Page 325 and 326:
Transport Tabel 324 Dræbte ved fæ
- Page 327 and 328:
Miljø og energi Figur 3 Udviklinge
- Page 329 and 330:
Miljø og energi I 2009 var statens
- Page 331 and 332:
Miljø og energi Tabel 326 Råstofi
- Page 333 and 334:
Miljø og energi Tabel 330 Badevand
- Page 335 and 336:
Miljø og energi Tabel 333 Bruttoen
- Page 337 and 338:
Miljø og energi Tabel 335 Produkti
- Page 339 and 340:
Udenrigsøkonomi I 2009 faldt handl
- Page 341 and 342:
Udenrigsøkonomi i de senere år er
- Page 343 and 344:
Udenrigsøkonomi Figur 10 Mængdein
- Page 345 and 346:
Udenrigsøkonomi For importen var d
- Page 347 and 348:
Udenrigsøkonomi Tabel 336 (side 1
- Page 349 and 350:
Udenrigsøkonomi Tabel 337 (side 1
- Page 351 and 352:
Udenrigsøkonomi Tabel 338 Import a
- Page 353 and 354:
Udenrigsøkonomi Tabel 340 Udenrigs
- Page 355 and 356:
Udenrigsøkonomi Tabel 342 De mest
- Page 357 and 358:
Udenrigsøkonomi Tabel 343 (side 2
- Page 359 and 360:
Udenrigsøkonomi Tabel 345 Betaling
- Page 361 and 362:
Udenrigsøkonomi 360 Statistisk År
- Page 363 and 364:
Nationalregnskab og betalingsbalanc
- Page 365 and 366:
Nationalregnskab og betalingsbalanc
- Page 367 and 368:
Nationalregnskab og betalingsbalanc
- Page 369 and 370:
Nationalregnskab Tabel 349 Forsynin
- Page 371 and 372:
Nationalregnskab Tabel 351 Nettovæ
- Page 373 and 374:
Nationalregnskab Tabel 354 Selskabs
- Page 375 and 376:
Nationalregnskab Tabel 356 Produkti
- Page 377 and 378:
Nationalregnskab Tabel 358 Aflønni
- Page 379 and 380:
Nationalregnskab Tabel 360 Beskæft
- Page 381 and 382:
Nationalregnskab Tabel 363 Faste br
- Page 383 and 384:
Nationalregnskab Tabel 364 (side 2
- Page 385 and 386:
Nationalregnskab Tabel 367 Fast rea
- Page 387 and 388:
Nationalregnskab Tabel 369 Finansie
- Page 389 and 390:
Nationalregnskab Tabel 371 Finansie
- Page 391 and 392:
Offentlige finanser Kommunalreforme
- Page 393 and 394:
Offentlige finanser Figur 5 Drifts-
- Page 395 and 396:
Offentlige finanser 4 Finansieringe
- Page 397 and 398:
Offentlige finanser Figur 12 De off
- Page 399 and 400:
Offentlige finanser Tabel 372 State
- Page 401 and 402:
Offentlige finanser Tabel 374 State
- Page 403 and 404:
Offentlige finanser Tabel 378 Regio
- Page 405 and 406:
Offentlige finanser Tabel 380 (side
- Page 407 and 408:
Offentlige finanser Tabel 381 Kommu
- Page 409 and 410:
Offentlige finanser Tabel 383 Perso
- Page 411 and 412:
Offentlige finanser Tabel 384 (side
- Page 413 and 414:
Offentlige finanser Tabel 386 Told
- Page 415 and 416:
Offentlige finanser Tabel 388 Udgif
- Page 417 and 418: Offentlige finanser Tabel 391 Det o
- Page 419 and 420: Offentlige finanser Tabel 394 Funkt
- Page 421 and 422: Offentlige finanser Tabel 396 Subsi
- Page 423 and 424: Offentlige finanser Tabel 398 Den s
- Page 425 and 426: Offentlige finanser Tabel 401 Stats
- Page 427 and 428: Penge- og kapitalmarked Den lange r
- Page 429 and 430: Penge- og kapitalmarked og mønter
- Page 431 and 432: Penge- og kapitalmarked Få store p
- Page 433 and 434: Penge- og kapitalmarked Tabel 405 D
- Page 435 and 436: Penge- og kapitalmarked Tabel 407 P
- Page 437 and 438: Penge- og kapitalmarked Tabel 410 R
- Page 439 and 440: Penge- og kapitalmarked Tabel 414 F
- Page 441 and 442: Penge- og kapitalmarked Tabel 418 E
- Page 443 and 444: Penge- og kapitalmarked Tabel 420 D
- Page 445 and 446: Penge- og kapitalmarked Tabel 423 S
- Page 447 and 448: Færøerne og Grønland Færøerne
- Page 449 and 450: Færøerne og Grønland Færøerne
- Page 451 and 452: Færøerne og Grønland Figur 4 Udv
- Page 453 and 454: International statistik Internation
- Page 455 and 456: International statistik 3 Internati
- Page 457 and 458: International statistik Tabel 427 H
- Page 459 and 460: International statistik Tabel 429 L
- Page 461 and 462: International statistik Tabel 431 B
- Page 463 and 464: International statistik Tabel 433 F
- Page 465 and 466: International statistik Tabel 435 U
- Page 467: International statistik Tabel 437 F
- Page 471 and 472: International statistik Tabel 441 B
- Page 473 and 474: International statistik Tabel 443
- Page 475 and 476: Dansk Branchekode og standardgruppe
- Page 477 and 478: Definitioner og ordforklaringer Def
- Page 479 and 480: Definitioner og ordforklaringer Arb
- Page 481 and 482: Definitioner og ordforklaringer Bru
- Page 483 and 484: Definitioner og ordforklaringer Del
- Page 485 and 486: Definitioner og ordforklaringer Fag
- Page 487 and 488: Definitioner og ordforklaringer For
- Page 489 and 490: Definitioner og ordforklaringer Ful
- Page 491 and 492: Definitioner og ordforklaringer Hov
- Page 493 and 494: Definitioner og ordforklaringer Inv
- Page 495 and 496: Definitioner og ordforklaringer Kø
- Page 497 and 498: Definitioner og ordforklaringer Mak
- Page 499 and 500: Definitioner og ordforklaringer Off
- Page 501 and 502: Definitioner og ordforklaringer Rec
- Page 503 and 504: Definitioner og ordforklaringer Spi
- Page 505 and 506: Definitioner og ordforklaringer Var
- Page 507 and 508: Stikordsregister Tal angiver sideta
- Page 509 and 510: Stikordsregister Tal angiver sideta
- Page 511 and 512: Stikordsregister Tal angiver sideta
- Page 513 and 514: Stikordsregister Tal angiver sideta
- Page 515 and 516: Stikordsregister Tal angiver sideta
- Page 517 and 518: Stikordsregister Tal angiver sideta
- Page 519 and 520:
Stikordsregister Tal angiver sideta
- Page 521 and 522:
Stikordsregister Tal angiver sideta
- Page 523 and 524:
Stikordsregister Tal angiver sideta