Carlos Manuel Rodrigues Machado Autonomic Ubiquitous Computing
Carlos Manuel Rodrigues Machado Autonomic Ubiquitous Computing
Carlos Manuel Rodrigues Machado Autonomic Ubiquitous Computing

Erfolgreiche ePaper selbst erstellen
Machen Sie aus Ihren PDF Publikationen ein blätterbares Flipbook mit unserer einzigartigen Google optimierten e-Paper Software.
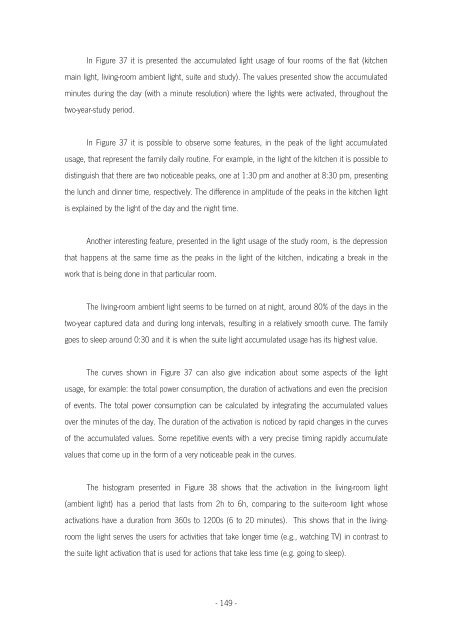
In Figure 37 it is presented the accumulated light usage of four rooms of the flat (kitchen<br />
main light, living-room ambient light, suite and study). The values presented show the accumulated<br />
minutes during the day (with a minute resolution) where the lights were activated, throughout the<br />
two-year-study period.<br />
In Figure 37 it is possible to observe some features, in the peak of the light accumulated<br />
usage, that represent the family daily routine. For example, in the light of the kitchen it is possible to<br />
distinguish that there are two noticeable peaks, one at 1:30 pm and another at 8:30 pm, presenting<br />
the lunch and dinner time, respectively. The difference in amplitude of the peaks in the kitchen light<br />
is explained by the light of the day and the night time.<br />
Another interesting feature, presented in the light usage of the study room, is the depression<br />
that happens at the same time as the peaks in the light of the kitchen, indicating a break in the<br />
work that is being done in that particular room.<br />
The living-room ambient light seems to be turned on at night, around 80% of the days in the<br />
two-year captured data and during long intervals, resulting in a relatively smooth curve. The family<br />
goes to sleep around 0:30 and it is when the suite light accumulated usage has its highest value.<br />
The curves shown in Figure 37 can also give indication about some aspects of the light<br />
usage, for example: the total power consumption, the duration of activations and even the precision<br />
of events. The total power consumption can be calculated by integrating the accumulated values<br />
over the minutes of the day. The duration of the activation is noticed by rapid changes in the curves<br />
of the accumulated values. Some repetitive events with a very precise timing rapidly accumulate<br />
values that come up in the form of a very noticeable peak in the curves.<br />
The histogram presented in Figure 38 shows that the activation in the living-room light<br />
(ambient light) has a period that lasts from 2h to 6h, comparing to the suite-room light whose<br />
activations have a duration from 360s to 1200s (6 to 20 minutes). This shows that in the living-<br />
room the light serves the users for activities that take longer time (e.g., watching TV) in contrast to<br />
the suite light activation that is used for actions that take less time (e.g. going to sleep).<br />
- 149 -