Land Brandenburg am 28.09.2008 - Amt für Statistik Berlin ...
Land Brandenburg am 28.09.2008 - Amt für Statistik Berlin ...
Land Brandenburg am 28.09.2008 - Amt für Statistik Berlin ...

Erfolgreiche ePaper selbst erstellen
Machen Sie aus Ihren PDF Publikationen ein blätterbares Flipbook mit unserer einzigartigen Google optimierten e-Paper Software.
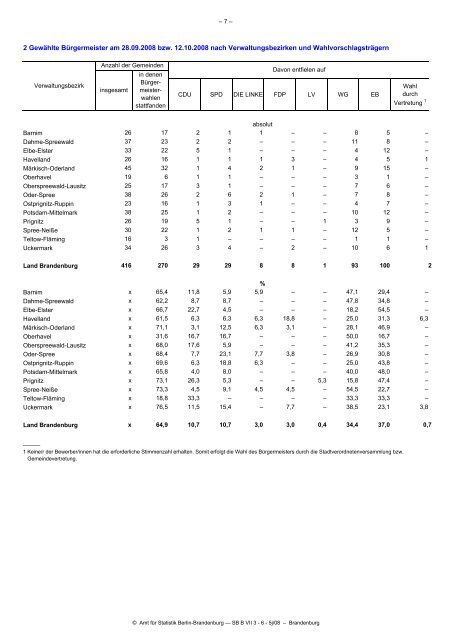
2 Gewählte Bürgermeister <strong>am</strong> <strong>28.09.2008</strong> bzw. 12.10.2008 nach Verwaltungsbezirken und Wahlvorschlagsträgern<br />
– 7 –<br />
Barnim 26 17 2 1<br />
absolut<br />
1 – – 8 5 –<br />
Dahme-Spreewald 37 23 2 2 – – – 11 8 –<br />
Elbe-Elster 33 22 5 1 – – – 4 12 –<br />
Havelland 26 16 1 1 1 3 – 4 5 1<br />
Märkisch-Oderland 45 32 1 4 2 1 – 9 15 –<br />
Oberhavel 19 6 1 1 – – – 3 1 –<br />
Oberspreewald-Lausitz 25 17 3 1 – – – 7 6 –<br />
Oder-Spree 38 26 2 6 2 1 – 7 8 –<br />
Ostprignitz-Ruppin 23 16 1 3 1 – – 4 7 –<br />
Potsd<strong>am</strong>-Mittelmark 38 25 1 2 – – – 10 12 –<br />
Prignitz 26 19 5 1 – – 1 3 9 –<br />
Spree-Neiße 30 22 1 2 1 1 – 12 5 –<br />
Teltow-Fläming 16 3 1 – – – – 1 1 –<br />
Uckermark 34 26 3 4 – 2 – 10 6 1<br />
<strong>Land</strong> <strong>Brandenburg</strong> 416 270 29 29 8 8 1 93 100 2<br />
Barnim x 65,4 11,8 5,9<br />
%<br />
5,9 – – 47,1 29,4 –<br />
Dahme-Spreewald x 62,2 8,7 8,7 – – – 47,8 34,8 –<br />
Elbe-Elster x 66,7 22,7 4,5 – – – 18,2 54,5 –<br />
Havelland x 61,5 6,3 6,3 6,3 18,8 – 25,0 31,3 6,3<br />
Märkisch-Oderland x 71,1 3,1 12,5 6,3 3,1 – 28,1 46,9 –<br />
Oberhavel x 31,6 16,7 16,7 – – – 50,0 16,7 –<br />
Oberspreewald-Lausitz x 68,0 17,6 5,9 – – – 41,2 35,3 –<br />
Oder-Spree x 68,4 7,7 23,1 7,7 3,8 – 26,9 30,8 –<br />
Ostprignitz-Ruppin x 69,6 6,3 18,8 6,3 – – 25,0 43,8 –<br />
Potsd<strong>am</strong>-Mittelmark x 65,8 4,0 8,0 – – – 40,0 48,0 –<br />
Prignitz x 73,1 26,3 5,3 – – 5,3 15,8 47,4 –<br />
Spree-Neiße x 73,3 4,5 9,1 4,5 4,5 – 54,5 22,7 –<br />
Teltow-Fläming x 18,8 33,3 – – – – 33,3 33,3 –<br />
Uckermark x 76,5 11,5 15,4 – 7,7 – 38,5 23,1 3,8<br />
<strong>Land</strong> <strong>Brandenburg</strong> x 64,9 10,7 10,7 3,0 3,0 0,4 34,4 37,0 0,7<br />
_____<br />
Verwaltungsbezirk<br />
Anzahl der Gemeinden<br />
insges<strong>am</strong>t<br />
in denen<br />
Bürgermeisterwahlen<br />
stattfanden<br />
CDU<br />
SPD DIE LINKE<br />
Davon entfielen auf<br />
FDP<br />
LV<br />
WG EB<br />
1 Keine/r der Bewerber/innen hat die erforderliche Stimmenzahl erhalten. Somit erfolgt die Wahl des Bürgermeisters durch die Stadtverordnetenvers<strong>am</strong>mlung bzw.<br />
Gemeindevertretung.<br />
© <strong>Amt</strong> <strong>für</strong> <strong>Statistik</strong> <strong>Berlin</strong>-<strong>Brandenburg</strong> — SB B VII 3 - 6 - 5j/08 – <strong>Brandenburg</strong><br />
Wahl<br />
durch<br />
Vertretung 1