World Dressage Masters Guide 2016
By Equine MERC
By Equine MERC

Create successful ePaper yourself
Turn your PDF publications into a flip-book with our unique Google optimized e-Paper software.
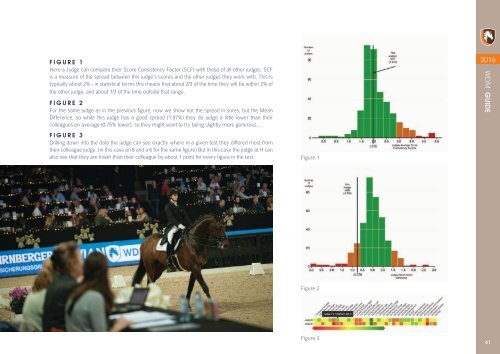
FIGURE 1<br />
Here a Judge can compare their Score Consistency Factor (SCF) with those of all other judges. SCF<br />
is a measure of the spread between this judge’s scores and the other judges they work with. This is<br />
typically about 2% - in statistical terms this means that about 2/3 of the time they will be within 2% of<br />
the other judge, and about 1/3 of the time outside that range.<br />
FIGURE 2<br />
For the same judge as in the previous figure, now we show not the spread in sores, but the Mean<br />
Difference, so while this judge has a good spread (1.97%) they do judge a little lower than their<br />
colleagues on average (0.75% lower), so they might want to try being slightly more generous….<br />
FIGURE 3<br />
Drilling down into the data the judge can see exactly where in a given test they differed most from<br />
their colleague judge. (in this case an 8 and a 6 for the same figure) But in this case the judge at H can<br />
also see that they are lower than their colleague by about 1 point for every figure in the test.<br />
Figure 1<br />
<strong>2016</strong><br />
WDM GUIDE<br />
Figure 2<br />
Figure 3<br />
61