

Pharmaceutical Royalties in Licensing Deals - PharmaVentures Ltd
Pharmaceutical Royalties in Licensing Deals - PharmaVentures Ltd
Pharmaceutical Royalties in Licensing Deals - PharmaVentures Ltd

Create successful ePaper yourself
Turn your PDF publications into a flip-book with our unique Google optimized e-Paper software.
<strong>Pharmaceutical</strong> Industry - No Place for the 25% Rule of Thumb<br />
agreed. Add to that the fact that some royalty rates exist well <strong>in</strong> excess of 25% of sales; the<br />
rule of thumb would seem to be of little use <strong>in</strong> def<strong>in</strong><strong>in</strong>g a suitable outcome.<br />
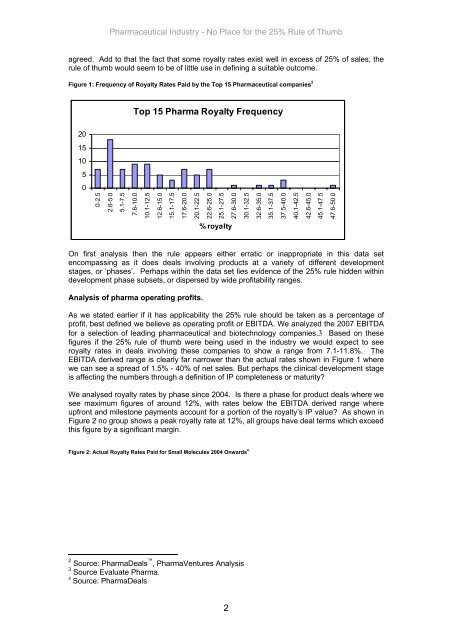
Figure 1: Frequency of Royalty Rates Paid by the Top 15 <strong>Pharmaceutical</strong> companies 2<br />
20<br />
15<br />
10<br />
5<br />
0<br />
0-2.5<br />
2.6-5.0<br />
5.1-7.5<br />
Top 15 Pharma Royalty Frequency<br />
7.6-10.0<br />
10.1-12.5<br />
12.6-15.0<br />
15.1-17.5<br />
17.6-20.0<br />
20.1-22.5<br />
22.6-25.0<br />
25.1-27.5<br />
% royalty<br />
On first analysis then the rule appears either erratic or <strong>in</strong>appropriate <strong>in</strong> this data set<br />
encompass<strong>in</strong>g as it does deals <strong>in</strong>volv<strong>in</strong>g products at a variety of different development<br />
stages, or ‘phases’. Perhaps with<strong>in</strong> the data set lies evidence of the 25% rule hidden with<strong>in</strong><br />
development phase subsets, or dispersed by wide profitability ranges.<br />
Analysis of pharma operat<strong>in</strong>g profits.<br />
As we stated earlier if it has applicability the 25% rule should be taken as a percentage of<br />
profit, best def<strong>in</strong>ed we believe as operat<strong>in</strong>g profit or EBITDA. We analyzed the 2007 EBITDA<br />
for a selection of lead<strong>in</strong>g pharmaceutical and biotechnology companies.3 Based on these<br />
figures if the 25% rule of thumb were be<strong>in</strong>g used <strong>in</strong> the <strong>in</strong>dustry we would expect to see<br />
royalty rates <strong>in</strong> deals <strong>in</strong>volv<strong>in</strong>g these companies to show a range from 7.1-11.8%. The<br />
EBITDA derived range is clearly far narrower than the actual rates shown <strong>in</strong> Figure 1 where<br />
we can see a spread of 1.5% - 40% of net sales. But perhaps the cl<strong>in</strong>ical development stage<br />
is affect<strong>in</strong>g the numbers through a def<strong>in</strong>ition of IP completeness or maturity?<br />
We analysed royalty rates by phase s<strong>in</strong>ce 2004. Is there a phase for product deals where we<br />
see maximum figures of around 12%, with rates below the EBITDA derived range where<br />
upfront and milestone payments account for a portion of the royalty’s IP value? As shown <strong>in</strong><br />
Figure 2 no group shows a peak royalty rate at 12%, all groups have deal terms which exceed<br />
this figure by a significant marg<strong>in</strong>.<br />
Figure 2: Actual Royalty Rates Paid for Small Molecules 2004 Onwards 4<br />
2 Source: Pharma<strong>Deals</strong> , <strong>PharmaVentures</strong> Analysis<br />
3 Source Evaluate Pharma.<br />
4 Source: Pharma<strong>Deals</strong><br />
2<br />
27.6-30.0<br />
30.1-32.5<br />
32.6-35.0<br />
35.1-37.5<br />
37.5-40.0<br />
40.1-42.5<br />
42.6-45.0<br />
45.1-47.5<br />
47.6-50.0