

bikescore explanation - PhysFarm Training Systems
bikescore explanation - PhysFarm Training Systems
bikescore explanation - PhysFarm Training Systems

Create successful ePaper yourself
Turn your PDF publications into a flip-book with our unique Google optimized e-Paper software.
Power (watts)<br />
700<br />
600<br />
500<br />
400<br />
300<br />
200<br />
100<br />
0<br />
Power Output, 30s MA, and 25s EWMA for Power Output<br />
10 12 14 16 18 20 22 24<br />
Time (Minutes)<br />
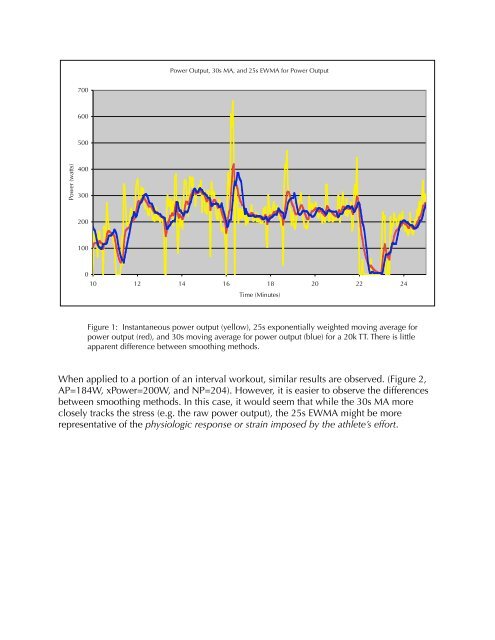
Figure 1: Instantaneous power output (yellow), 25s exponentially weighted moving average for<br />
power output (red), and 30s moving average for power output (blue) for a 20k TT. There is little<br />
apparent difference between smoothing methods.<br />
When applied to a portion of an interval workout, similar results are observed. (Figure 2,<br />
AP=184W, xPower=200W, and NP=204). However, it is easier to observe the differences<br />
between smoothing methods. In this case, it would seem that while the 30s MA more<br />
closely tracks the stress (e.g. the raw power output), the 25s EWMA might be more<br />
representative of the physiologic response or strain imposed by the athlete’s effort.