Reliability Engineering Course - PetroEdge Asia
Reliability Engineering Course - PetroEdge Asia
Reliability Engineering Course - PetroEdge Asia
Create successful ePaper yourself
Turn your PDF publications into a flip-book with our unique Google optimized e-Paper software.
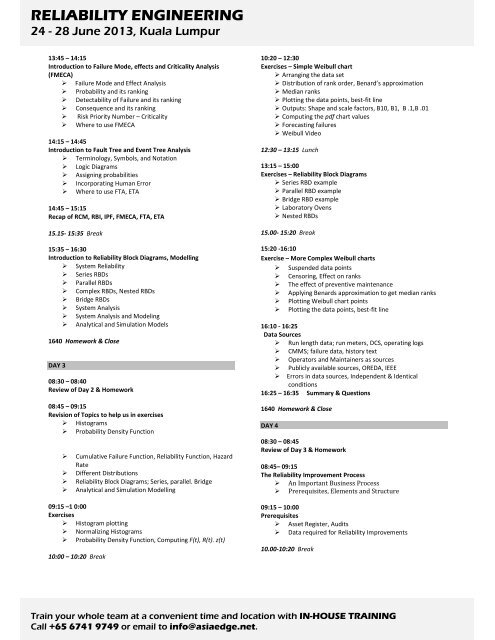
RELIABILITY ENGINEERING<br />
24 - 28 June 2013, Kuala Lumpur<br />
13:45 – 14:15<br />
Introduction to Failure Mode, effects and Criticality Analysis<br />
(FMECA)<br />
� Failure Mode and Effect Analysis<br />
� Probability and its ranking<br />
� Detectability of Failure and its ranking<br />
� Consequence and its ranking<br />
� Risk Priority Number – Criticality<br />
� Where to use FMECA<br />
14:15 – 14:45<br />
Introduction to Fault Tree and Event Tree Analysis<br />
� Terminology, Symbols, and Notation<br />
� Logic Diagrams<br />
� Assigning probabilities<br />
� Incorporating Human Error<br />
� Where to use FTA, ETA<br />
14:45 – 15:15<br />
Recap of RCM, RBI, IPF, FMECA, FTA, ETA<br />
15.15- 15:35 Break<br />
15:35 – 16:30<br />
Introduction to <strong>Reliability</strong> Block Diagrams, Modelling<br />
� System <strong>Reliability</strong><br />
� Series RBDs<br />
� Parallel RBDs<br />
� Complex RBDs, Nested RBDs<br />
� Bridge RBDs<br />
� System Analysis<br />
� System Analysis and Modeling<br />
� Analytical and Simulation Models<br />
1640 Homework & Close<br />
DAY 3<br />
08:30 – 08:40<br />
Review of Day 2 & Homework<br />
08:45 – 09:15<br />
Revision of Topics to help us in exercises<br />
� Histograms<br />
� Probability Density Function<br />
� Cumulative Failure Function, <strong>Reliability</strong> Function, Hazard<br />
Rate<br />
� Different Distributions<br />
� <strong>Reliability</strong> Block Diagrams; Series, parallel. Bridge<br />
� Analytical and Simulation Modelling<br />
09:15 –1 0:00<br />
Exercises<br />
� Histogram plotting<br />
� Normalizing Histograms<br />
� Probability Density Function, Computing F(t), R(t). z(t)<br />
10:00 – 10:20 Break<br />
10:20 – 12:30<br />
Exercises – Simple Weibull chart<br />
� Arranging the data set<br />
� Distribution of rank order, Benard’s approximation<br />
� Median ranks<br />
� Plotting the data points, best-fit line<br />
� Outputs: Shape and scale factors, B10, B1, B .1,B .01<br />
� Computing the pdf chart values<br />
� Forecasting failures<br />
� Weibull Video<br />
12:30 – 13:15 Lunch<br />
13:15 – 15:00<br />
Exercises – <strong>Reliability</strong> Block Diagrams<br />
� Series RBD example<br />
� Parallel RBD example<br />
� Bridge RBD example<br />
� Laboratory Ovens<br />
� Nested RBDs<br />
15.00- 15:20 Break<br />
15:20 -16:10<br />
Exercise – More Complex Weibull charts<br />
� Suspended data points<br />
� Censoring, Effect on ranks<br />
� The effect of preventive maintenance<br />
� Applying Benards approximation to get median ranks<br />
� Plotting Weibull chart points<br />
� Plotting the data points, best-fit line<br />
16:10 - 16:25<br />
Data Sources<br />
� Run length data; run meters, DCS, operating logs<br />
� CMMS; failure data, history text<br />
� Operators and Maintainers as sources<br />
� Publicly available sources, OREDA, IEEE<br />
� Errors in data sources, Independent & Identical<br />
conditions<br />
16:25 – 16:35 Summary & Questions<br />
1640 Homework & Close<br />
Train your whole team at a convenient time and location with IN-HOUSE TRAINING<br />
Call +65 6741 9749 or email to info@asiaedge.net.<br />
DAY 4<br />
08:30 – 08:45<br />
Review of Day 3 & Homework<br />
08:45– 09:15<br />
The <strong>Reliability</strong> Improvement Process<br />
� An Important Business Process<br />
� Prerequisites, Elements and Structure<br />
09:15 – 10:00<br />
Prerequisites<br />
� Asset Register, Audits<br />
� Data required for <strong>Reliability</strong> Improvements<br />
10.00-10:20 Break


