Voxengo SPAN User Guide
Voxengo SPAN User Guide
Voxengo SPAN User Guide

Create successful ePaper yourself
Turn your PDF publications into a flip-book with our unique Google optimized e-Paper software.
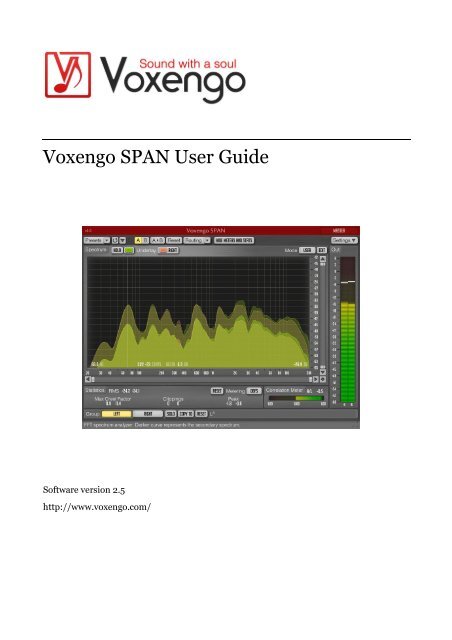
<strong>Voxengo</strong> <strong>SPAN</strong> <strong>User</strong> <strong>Guide</strong><br />
Software version 2.5<br />
http://www.voxengo.com/
<strong>Voxengo</strong> <strong>SPAN</strong> <strong>User</strong> <strong>Guide</strong><br />
Contents<br />
Introduction 3<br />
Features 3<br />
Compatibility 3<br />
<strong>User</strong> Interface Elements 4<br />
Credits 6<br />
Spectrum 4<br />
Statistics 4<br />
Correlation Meter 5<br />
Copyright © 2004-2013 Aleksey Vaneev 2
<strong>Voxengo</strong> <strong>SPAN</strong> <strong>User</strong> <strong>Guide</strong><br />
Introduction<br />
<strong>SPAN</strong> is a real-time “fast Fourier transform” audio spectrum analyzer plug-in for<br />
professional music and audio production applications. For the most part it was<br />
derived from <strong>Voxengo</strong> GlissEQ dynamic parametric equalizer and reproduces its<br />
spectrum analysis functionality.<br />
<strong>SPAN</strong> provides you with a very flexible “mode” system which you can use to setup<br />
your spectrum analyzer preferences. You may specify Fourier block size in samples,<br />
FFT window overlap percentage, spectrum's visual slope. Beside that you can choose<br />
to display secondary spectrum of a desired type (e.g. real-time maximum, all-time<br />
maximum). Spectrum can be smoothed out visually for an easier examination.<br />
<strong>SPAN</strong> supports multi-channel analysis and can be set to display spectrums from two<br />
different channels or channel groups at the same time. Spectrum's color can be<br />
chosen to taste.<br />
<strong>SPAN</strong> also features output level metering with adjustable ballistics and integration<br />
time, K-metering (including calibration K-metering). <strong>SPAN</strong> displays level metering<br />
statistics, headroom estimation and clipping detection. Correlation metering is<br />
available as well.<br />
Features<br />
� Output signal power statistics<br />
� Spectrum smoothing<br />
� <strong>User</strong> interface window resizing<br />
� Clipping statistics<br />
� Correlation meter<br />
� K-metering<br />
� Stereo and multi-channel analysis<br />
� Mid/side analysis<br />
� Internal channel routing<br />
� Channel grouping<br />
� Preset manager<br />
� Undo/redo history<br />
� A/B comparisons<br />
� Contextual hint messages<br />
� All sample rates support<br />
Compatibility<br />
This audio plug-in can be loaded into any audio host application that conforms to the<br />
AudioUnit or VST plug-in specification.<br />
This plug-in is compatible with Windows (32- and 64-bit Windows 7, Vista, XP) and<br />
Mac OS X (10.5 and later versions, 32- and 64-bit, Intel processor-based) computers<br />
(2 GHz dual-core or faster processor with at least 1 GB of system RAM required). A<br />
separate binary distribution file is available for each target computer platform for<br />
each audio plug-in specification.<br />
Copyright © 2004-2013 Aleksey Vaneev 3
<strong>Voxengo</strong> <strong>SPAN</strong> <strong>User</strong> <strong>Guide</strong><br />
<strong>User</strong> Interface Elements<br />
Note: Most interface elements (buttons, labels) located on the top of the user<br />
interface and on the bottom are standard among all <strong>Voxengo</strong> plug-ins and do not<br />
require much learning effort. For an in-depth description of these and other<br />
standard user interface elements and features please refer to the “<strong>Voxengo</strong> Primary<br />
<strong>User</strong> <strong>Guide</strong>”. Learned once it will allow you to feel comfortable with all pro audio<br />
plug-ins from <strong>Voxengo</strong>.<br />
Spectrum<br />
This bigger panel displays the spectrum (in the specified color) of the current channel<br />
group. Note that the secondary spectrum is displayed in a darker color. You may use<br />
the “narrow-band sweeping” mode by holding the “Ctrl” (“Command” on Mac OS X)<br />
key.<br />
The “Hold” switch allows you to hold spectrum updates temporarily for the purpose<br />
of visual comparison. Note that spectrum updates will be automatically resumed<br />
whenever you switch between channel groups.<br />
The “Underlay” selector allows you to add an additional underlying spectrum (in a<br />
specified color) from another channel group of the current plug-in instance. If you<br />
would like to see spectrums of left and right channels together, please load the “Dual<br />
Mono” routing preset and set the “Underlay” selector to “Right”.<br />
Even though in some host audio applications (e.g. Ableton Live) <strong>SPAN</strong> in VST format<br />
exposes 8 audio inputs, it does not mean it can display more than 2 spectrums at the<br />
same time. Please consider using GlissEQ if you would like to perform cross-track<br />
multi-spectrum analysis.<br />
The “Hide Meters and Stats” switch hides all meters and statistics panels and extends<br />
the spectrum analyzer panel.<br />
The “Mode” selector allows you to select and edit spectrum’s display mode. Please<br />
refer to the “<strong>Voxengo</strong> Primary <strong>User</strong> <strong>Guide</strong>” (namely, the topic called “Standard<br />
Controls – Spectrum Mode Editor”) for in-depth information about spectrum mode<br />
settings.<br />
Note that by default <strong>SPAN</strong> uses 4.5 dB per octave slope for the spectrum display<br />
which makes it look considerably “elevated” towards the higher frequencies in<br />
comparison to most other spectrum analyzers available on the market. This setting<br />
can be changed in the “Spectrum Mode Editor” window.<br />
Statistics<br />
This pane displays historic (since the last reset or playback start) statistical<br />
information for each channel of the currently selected channel group.<br />
The “RMS” indicator displays un-weighted RMS signal power estimation.<br />
The “Max Crest Factor” indicator shows maximum crest factor (difference) between<br />
the RMS and peak RMS values reached. Peak RMS value is not displayed anywhere<br />
on the user interface. 50 ms time window is used to estimate the peak RMS value.<br />
Copyright © 2004-2013 Aleksey Vaneev 4
<strong>Voxengo</strong> <strong>SPAN</strong> <strong>User</strong> <strong>Guide</strong><br />
You may add the “RMS” and “Max Crest Factor” values together to obtain a peak<br />
RMS value. Note that when comparing the “Max Crest Factor” value in <strong>SPAN</strong> to<br />
other plug-ins the peak RMS time windows should be matched in the plug-ins in<br />
comparison or otherwise the readings will be different, with shorter peak RMS time<br />
window (e.g. instant peak value) showing a greater “Max Crest Factor” value.<br />
The clipping indication is useful when using noise-shaping at low bit depth dithering<br />
settings since noise becomes powerful enough to go over 0 dBFS.<br />
The “Peak” indicator displays 1-sample output peak level.<br />
The “Reset” button can be used to reset counters and start statistical accumulation<br />
over.<br />
The “Metering” selector allows you to choose the meter biasing mode. The “dBFS”<br />
mode applies no biasing. The “dBFS+3” mode adds 3 dB to level meter indicators,<br />
the “RMS” and “Peak” values (peak level indication on the level meter is unchanged<br />
in comparison to the “dBFS” mode). The “K-20”, “K-14” and “K-12” modes offer<br />
various K-system biasing modes originally offered by Bob Katz. The “K-20 C”, “K-14<br />
C” and “K-12 C” implement level calibration modes. In these “K” modes level meter’s<br />
RMS integration and release time constants are fixed to 600 ms as per K-system<br />
specification.<br />
Correlation Meter<br />
This panel contains meter that shows average real-time correlation between two first<br />
input channels.<br />
This panel also shows the average balance (in decibel) between two first input<br />
channels during the last 3 seconds. Negative values tell that the first (left) channel is<br />
louder by the specified number of decibel.<br />
Please read the topic named the “Knowledge Bit – Correlation” in the “<strong>Voxengo</strong><br />
Primary <strong>User</strong> <strong>Guide</strong>” for a specific information on correlation values and their<br />
possible meaning.<br />
Copyright © 2004-2013 Aleksey Vaneev 5
<strong>Voxengo</strong> <strong>SPAN</strong> <strong>User</strong> <strong>Guide</strong><br />
Credits<br />
This plug-in was produced by Aleksey Vaneev in Syktyvkar, Komi Republic, Russia.<br />
DSP algorithms and internal signal routing code were created by Aleksey Vaneev.<br />
Graphics user interface code and the “standard” graphics design were created by<br />
Vladimir Stolypko.<br />
Plug-in is implemented in multi-platform C++ code form and uses “zlib” compression<br />
library (written by Jean-loup Gailly and Mark Adler), filter design equations by<br />
Magnus Jonsson, VST plug-in technology by Steinberg, AudioUnit plug-in SDK by<br />
Apple, Inc. (used under the corresponding licenses granted by these parties).<br />
<strong>Voxengo</strong> <strong>SPAN</strong> Copyright © 2004-2013 Aleksey Vaneev.<br />
VST is a trademark and software of Steinberg Media Technologies GmbH.<br />
Copyright © 2004-2013 Aleksey Vaneev 6