Acoustic monopoles, dipoles, and quadrupoles
Acoustic monopoles, dipoles, and quadrupoles
Acoustic monopoles, dipoles, and quadrupoles

Create successful ePaper yourself
Turn your PDF publications into a flip-book with our unique Google optimized e-Paper software.
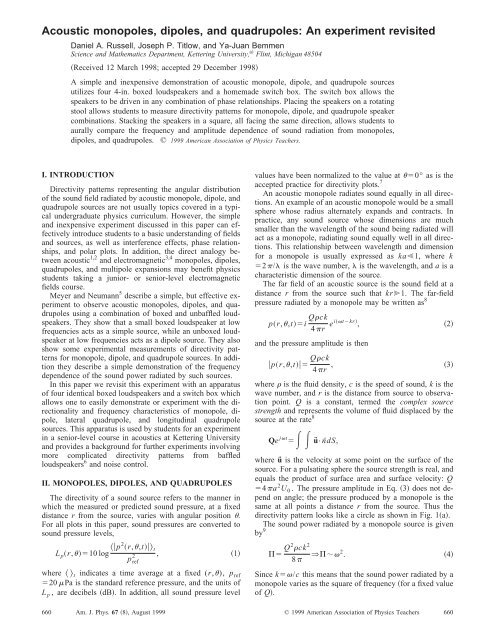
<strong>Acoustic</strong> <strong>monopoles</strong>, <strong>dipoles</strong>, <strong>and</strong> <strong>quadrupoles</strong>: An experiment revisited<br />
Daniel A. Russell, Joseph P. Titlow, <strong>and</strong> Ya-Juan Bemmen<br />
Science <strong>and</strong> Mathematics Department, Kettering University, a� Flint, Michigan 48504<br />
�Received 12 March 1998; accepted 29 December 1998�<br />
A simple <strong>and</strong> inexpensive demonstration of acoustic monopole, dipole, <strong>and</strong> quadrupole sources<br />
utilizes four 4-in. boxed loudspeakers <strong>and</strong> a homemade switch box. The switch box allows the<br />
speakers to be driven in any combination of phase relationships. Placing the speakers on a rotating<br />
stool allows students to measure directivity patterns for monopole, dipole, <strong>and</strong> quadrupole speaker<br />
combinations. Stacking the speakers in a square, all facing the same direction, allows students to<br />
aurally compare the frequency <strong>and</strong> amplitude dependence of sound radiation from <strong>monopoles</strong>,<br />
<strong>dipoles</strong>, <strong>and</strong> <strong>quadrupoles</strong>. © 1999 American Association of Physics Teachers.<br />
I. INTRODUCTION<br />
Directivity patterns representing the angular distribution<br />
of the sound field radiated by acoustic monopole, dipole, <strong>and</strong><br />
quadrupole sources are not usually topics covered in a typical<br />
undergraduate physics curriculum. However, the simple<br />
<strong>and</strong> inexpensive experiment discussed in this paper can effectively<br />
introduce students to a basic underst<strong>and</strong>ing of fields<br />
<strong>and</strong> sources, as well as interference effects, phase relationships,<br />
<strong>and</strong> polar plots. In addition, the direct analogy between<br />
acoustic 1,2 <strong>and</strong> electromagnetic 3,4 <strong>monopoles</strong>, <strong>dipoles</strong>,<br />
<strong>quadrupoles</strong>, <strong>and</strong> multipole expansions may benefit physics<br />
students taking a junior- or senior-level electromagnetic<br />
fields course.<br />
Meyer <strong>and</strong> Neumann 5 describe a simple, but effective experiment<br />
to observe acoustic <strong>monopoles</strong>, <strong>dipoles</strong>, <strong>and</strong> <strong>quadrupoles</strong><br />
using a combination of boxed <strong>and</strong> unbaffled loudspeakers.<br />
They show that a small boxed loudspeaker at low<br />
frequencies acts as a simple source, while an unboxed loudspeaker<br />
at low frequencies acts as a dipole source. They also<br />
show some experimental measurements of directivity patterns<br />
for monopole, dipole, <strong>and</strong> quadrupole sources. In addition<br />
they describe a simple demonstration of the frequency<br />
dependence of the sound power radiated by such sources.<br />
In this paper we revisit this experiment with an apparatus<br />
of four identical boxed loudspeakers <strong>and</strong> a switch box which<br />
allows one to easily demonstrate or experiment with the directionality<br />
<strong>and</strong> frequency characteristics of monopole, dipole,<br />
lateral quadrupole, <strong>and</strong> longitudinal quadrupole<br />
sources. This apparatus is used by students for an experiment<br />
in a senior-level course in acoustics at Kettering University<br />
<strong>and</strong> provides a background for further experiments involving<br />
more complicated directivity patterns from baffled<br />
loudspeakers 6 <strong>and</strong> noise control.<br />
II. MONOPOLES, DIPOLES, AND QUADRUPOLES<br />
The directivity of a sound source refers to the manner in<br />
which the measured or predicted sound pressure, at a fixed<br />
distance r from the source, varies with angular position �.<br />
For all plots in this paper, sound pressures are converted to<br />
sound pressure levels,<br />
L p�r,���10 log ��p2 �r,�,t���t<br />
2 , �1�<br />
pref where ��t indicates a time average at a fixed (r,�), pref �20 �Pa is the st<strong>and</strong>ard reference pressure, <strong>and</strong> the units of<br />
L p , are decibels �dB�. In addition, all sound pressure level<br />
values have been normalized to the value at ��0° as is the<br />
accepted practice for directivity plots. 7<br />
An acoustic monopole radiates sound equally in all directions.<br />
An example of an acoustic monopole would be a small<br />
sphere whose radius alternately exp<strong>and</strong>s <strong>and</strong> contracts. In<br />
practice, any sound source whose dimensions are much<br />
smaller than the wavelength of the sound being radiated will<br />
act as a monopole, radiating sound equally well in all directions.<br />
This relationship between wavelength <strong>and</strong> dimension<br />
for a monopole is usually expressed as ka�1, where k<br />
�2�/� is the wave number, � is the wavelength, <strong>and</strong> a is a<br />
characteristic dimension of the source.<br />
The far field of an acoustic source is the sound field at a<br />
distance r from the source such that kr�1. The far-field<br />
pressure radiated by a monopole may be written as 8<br />
p�r,�,t��i Q�ck<br />
4�r ei��t�kr� , �2�<br />
<strong>and</strong> the pressure amplitude is then<br />
�p�r,�,t��� Q�ck<br />
, �3�<br />
4�r<br />
where � is the fluid density, c is the speed of sound, k is the<br />
wave number, <strong>and</strong> r is the distance from source to observation<br />
point. Q is a constant, termed the complex source<br />
strength <strong>and</strong> represents the volume of fluid displaced by the<br />
source at the rate 8<br />
Qe j�t ���u�•nˆdS,<br />
where u� is the velocity at some point on the surface of the<br />
source. For a pulsating sphere the source strength is real, <strong>and</strong><br />
equals the product of surface area <strong>and</strong> surface velocity: Q<br />
�4�a 2 U 0 . The pressure amplitude in Eq. �3� does not depend<br />
on angle; the pressure produced by a monopole is the<br />
same at all points a distance r from the source. Thus the<br />
directivity pattern looks like a circle as shown in Fig. 1�a�.<br />
The sound power radiated by a monopole source is given<br />
by 9<br />
�� Q2�ck2 8� ⇒���2 . �4�<br />
Since k��/c this means that the sound power radiated by a<br />
monopole varies as the square of frequency �for a fixed value<br />
of Q�.<br />
660 Am. J. Phys. 67 �8�, August 1999 © 1999 American Association of Physics Teachers<br />
660
Fig. 1. Theoretical directivity patterns for far-field sound pressure levels<br />
radiated from �a� monopole, �b� dipole, �c� lateral quadrupole, <strong>and</strong> �d� longitudinal<br />
quadrupole sound sources.<br />
Two <strong>monopoles</strong> of equal source strength, but opposite<br />
phase, <strong>and</strong> separated by a small distance d �such that kd<br />
�1� comprise an acoustic dipole. In contrast to a single<br />
monopole, there is no net introduction of fluid by a dipole.<br />
As one source ‘‘exhales,’’ the other source ‘‘inhales’’ <strong>and</strong><br />
the fluid surrounding the dipole simply sloshes back <strong>and</strong><br />
forth between the sources. It is the net force on the fluid<br />
which causes energy to be radiated in the form of sound<br />
waves.<br />
The far-field expression for the pressure radiated by an<br />
acoustic dipole may be written as 10<br />
p�r,�,t���i Q�ck2 d<br />
4�r<br />
cos �e i��t�kr� . �5�<br />
This is a spherically diverging wave with pressure amplitude<br />
which may be interpreted as the product of the pressure amplitude<br />
radiated by a monopole, a term kd which relates the<br />
radiated wavelength to the source separation, <strong>and</strong> a directivity<br />
function which depends on the angle �. A dipole does not<br />
radiate equally in all directions. Instead its directivity pattern,<br />
as shown in Fig. 1�b�, has maxima along the 0° <strong>and</strong><br />
180° directions, <strong>and</strong> no sound radiation along the 90° <strong>and</strong><br />
270° directions.<br />
The sound power radiated by an acoustic dipole may be<br />
expressed as 9<br />
�6�<br />
Fig. 2. �a� Lateral quadrupole <strong>and</strong> �b� longitudinal quadrupole source.<br />
� D� Q2 �ck 4 d 2<br />
6� ⇒���4 . �7�<br />
The dipole power varies with frequency as � 4 , which means<br />
that a dipole is less efficient than a monopole �with the same<br />
source strength� at radiating low frequency sounds.<br />
A quadrupole source consists of two identical <strong>dipoles</strong>,<br />
with opposite phase <strong>and</strong> separated by small distance D. In<br />
the case of the quadrupole, there is no net flux of fluid <strong>and</strong> no<br />
net force on the fluid. It is the fluctuating stress on the fluid<br />
that generates the sound waves. However, since fluids don’t<br />
support shear stresses well, <strong>quadrupoles</strong> are poor radiators of<br />
sound. For a lateral quadrupole source the dipole axes do<br />
not lie along the same line, as shown in Fig. 2�a�, while for a<br />
longitudinal quadrupole source, the dipole axes do lie along<br />
the same line, as shown in Fig. 2�b�.<br />
The far-field sound pressure amplitude produced by a lateral<br />
quadrupole may be written as 10<br />
which may be interpreted as the product of a simple source,<br />
a term 4k 2 dD which relates the radiated wavelength to the<br />
quadrupole source separations, <strong>and</strong> a directivity function<br />
which depends on the angle �. There are four directions<br />
where sound is radiated very well, <strong>and</strong> four directions in<br />
which destructive interference occurs <strong>and</strong> no sound is radiated.<br />
The far-field sound pressure amplitude produced by a longitudinal<br />
quadrupole may be written as 10<br />
which can be interpreted as the product of a simple source,<br />
the dimensionless size term 4k 2 dD, <strong>and</strong> the directivity function<br />
which depends on the angles �. This directivity pattern,<br />
shown in Fig. 1�d�, looks similar to that of the dipole source<br />
in Fig. 1�b�. There are two directions in which sound is radiated<br />
extremely well, <strong>and</strong> two directions in which no sound<br />
is radiated. However, the width of the lobes is narrower than<br />
for the dipole; at 60° the longitudinal quadrupole directivity<br />
is approximately 5 dB less than that of the dipole.<br />
The power radiated by a quadrupole varies according to<br />
the sixth power of frequency (� Q�� 6 ), which means that<br />
<strong>quadrupoles</strong> should be even less efficient radiators of low<br />
frequencies than <strong>dipoles</strong> �with the same source strength�. 9<br />
661 Am. J. Phys., Vol. 67, No. 8, August 1999 Russell, Titlow, <strong>and</strong> Bemmen<br />
661<br />
�8�<br />
�9�
Fig. 3. Measured directivity patterns for a single boxed 4-in. speaker at �a�<br />
250 Hz <strong>and</strong> �b� 10 kHz.<br />
III. MEASURED DIRECTIVITY PATTERNS<br />
In this experiment, our simple source is a 4-in. boxed<br />
loudspeaker 11 producing a 250-Hz pure sine tone. For this<br />
source, a�4 in.�0.10 m <strong>and</strong> k�2�/��2� f /c�4.58,<br />
where c�343 m/s is the speed of sound in air at room temperature<br />
�20 °C�. Thus, for our source, ka�0.46, which is<br />
close to the simple source approximation. To verify that this<br />
loudspeaker was indeed behaving as a simple source at 250<br />
Hz, the speaker was placed on a rotating stool at a height of<br />
80 cm above a carpeted floor. A sound level meter 12 was<br />
placed at the same height <strong>and</strong> 1 m from the speaker, pointed<br />
toward the speaker. Figure 3�a� shows the measured directivity<br />
pattern for a single speaker. At 250 Hz, it clearly behaves<br />
as a simple source, essentially radiating sound equally<br />
well in all directions. At higher frequencies, however, the<br />
speaker becomes very directional, as is shown in Fig. 3�b�<br />
for a 10-kHz pure sine signal. While the main emphasis of<br />
this experiment is to measure the directivity patterns of various<br />
sources, we did find that the loudspeakers used in this<br />
experiment have a relatively flat frequency response over the<br />
range 100 Hz–10 kHz.<br />
In order to measure the directivity pattern of monopole,<br />
dipole, <strong>and</strong> quadrupole sources, four 4-in. boxed loudspeakers<br />
were symmetrically placed on a rotating stool, facing<br />
outwards, as shown in Fig. 4. Each speaker was wired to a<br />
double-pole-double-throw switch so that the speaker polarity,<br />
or phase, could be reversed by simply throwing the<br />
switch. The speakers were driven by an amplified sinusoidal<br />
signal; the single channel output of the amplifier was split<br />
four ways using Y connectors. To ensure that each of the four<br />
Fig. 4. Apparatus for demonstrating <strong>and</strong> measuring directivity patterns for<br />
<strong>monopoles</strong>, <strong>dipoles</strong>, <strong>and</strong> <strong>quadrupoles</strong>.<br />
Fig. 5. Apparatus for demonstrating <strong>and</strong> measuring directivity patterns for<br />
<strong>monopoles</strong>, <strong>dipoles</strong>, <strong>and</strong> <strong>quadrupoles</strong>.<br />
speakers were acting as identical sources, the sound pressure<br />
level directly in front of each speaker was measured; for our<br />
four speakers the results varied by less than 1 dB.<br />
The directivity of the sound field produced by the speaker<br />
configuration was measured by a stationary sound level<br />
meter placed at a distance of 1 m from the center of the<br />
speaker arrangement as shown in Fig. 5. Alternately, the output<br />
from a cheap electret microphone could be displayed on<br />
an oscilloscope. The biggest difficulty we faced in collecting<br />
clean data was the elimination of reflections from nearby<br />
walls or obstacles <strong>and</strong> st<strong>and</strong>ing waves in the room in which<br />
the experiment was performed. The speakers were placed on<br />
a rotating stool 1 m off the floor, with the center of the stool<br />
about 30 cm from a wall, <strong>and</strong> 2 m from the nearest corner in<br />
the room. There were no tables or other obstacles within a<br />
4-m distance. The floor was carpeted <strong>and</strong> two large pieces<br />
(4ft�4 ft) of absorbing foam material were attached to the<br />
wall behind the speakers to reduce reflections. Care was<br />
taken that reflections from the bodies of the data collectors<br />
did not interfere with the measured sound pressure levels.<br />
When all four speakers were driven with the same polarity<br />
they acted as identical in-phase sources, <strong>and</strong> together as a<br />
monopole �omnidirectional� sound source. Figure 6�a� shows<br />
the measured directivity pattern for the monopole arrangement<br />
of the four speakers. The accuracy of the measured<br />
values is �0.5 dB. As expected, the monopole source radiates<br />
essentially the same in all directions.<br />
When speaker pairs 1–2 <strong>and</strong> 3–4 had the opposite polarity<br />
the system acted as a dipole source �alternately, the speakers<br />
could have been paired as 1–4 <strong>and</strong> 2–3�. Figure 6�b� shows<br />
the measured directivity pattern for the dipole arrangement<br />
of the four speakers. The solid curve represents the theoretical<br />
prediction for the dipole from Eq. �5� The agreement<br />
between theory <strong>and</strong> measurement is quite good.<br />
When speaker pairs 1–3 <strong>and</strong> 2–4 had the opposite polarity<br />
the system acted as a lateral quadrupole source. Figure 6�c�<br />
shows the measured directivity pattern for the lateral quadrupole<br />
arrangement of the four speakers. The solid curve<br />
represents the theoretical prediction for the lateral quadrupole<br />
from Eq. �8�. The agreement between theory <strong>and</strong> measurement<br />
is excellent.<br />
To make a longitudinal quadrupole, the four speakers were<br />
equally spaced along a board on the stool. The outer pair <strong>and</strong><br />
the inner pair of speakers had the opposite phase, as per Fig.<br />
2�b�. The sound level meter was moved back to a distance of<br />
662 Am. J. Phys., Vol. 67, No. 8, August 1999 Russell, Titlow, <strong>and</strong> Bemmen<br />
662
Fig. 6. Measured directivity patterns at 250 Hz for sound radiation from �a�<br />
monopole, �b� dipole, �c� lateral quadrupole, <strong>and</strong> �d� longitudinal quadrupole<br />
configurations of four 4-in. boxed loudspeakers. Speaker orientation <strong>and</strong><br />
relative phase is indicated by the black <strong>and</strong> white boxes at the center of each<br />
plot.<br />
2 m from the center of the speaker arrangement. Figure 6�d�<br />
shows the measured directivity pattern for the longitudinal<br />
quadrupole arrangement of the four speakers. The solid<br />
curve represents the theoretical prediction for the longitudinal<br />
quadrupole from Eq. �9�. The agreement between theory<br />
<strong>and</strong> measurement is not as good for this arrangement. At this<br />
point, students are introduced to the concept of far field versus<br />
near field. A longitudinal quadrupole has a rather complicated<br />
near field <strong>and</strong> an observer must be in the deep far<br />
field kr�1 for the approximation in Eq. �9� to be valid.<br />
Since our measurements were made at a distance of 2 m<br />
from a 250-Hz source, our value of kr�9.16, which is not<br />
exactly much greater than 1. The directivity portion of the<br />
exact expression for the near field radiated by a longitudinal<br />
quadrupole source may be derived as 1,10<br />
p�r,�����1�3 cos 2 ���<br />
ik 1<br />
�<br />
r r2 � k2<br />
3 � � k2<br />
�10�<br />
3�,<br />
Fig. 7. Measured directivity patterns at 250 Hz for sound radiation from a<br />
longitudinal quadrupole compared with the exact near-field expression calculated<br />
for r�2 m.<br />
Fig. 8. Speaker arrangement <strong>and</strong> polarities for audible demonstration of<br />
sound power radiated by �a� monopole, �b� <strong>and</strong> �c� dipole, <strong>and</strong> �d� quadrupole<br />
sources.<br />
which for large kr reduces to the directivity term in Eq. �9�.<br />
Figure 7 shows the same measured data as in Fig. 6�d� compared<br />
with the exact near-field expression. Now the fit is<br />
much closer in the regions around 90° <strong>and</strong> 270°. Differences<br />
between measured values <strong>and</strong> theory are most likely due to<br />
reflections from equipment in the laboratory.<br />
Fig. 9. Comparisons of 1/3-octave b<strong>and</strong> measurement of pink noise played<br />
through four 4-in. speakers arranged as �a� monopole <strong>and</strong> dipole, �b� monopole<br />
<strong>and</strong> quadrupole.<br />
663 Am. J. Phys., Vol. 67, No. 8, August 1999 Russell, Titlow, <strong>and</strong> Bemmen<br />
663
IV. AUDIBLE DEMONSTRATION<br />
A comparison of the effectiveness of monopole, dipole,<br />
<strong>and</strong> quadrupole sources at radiating low frequencies may be<br />
demonstrated very effectively using the apparatus described<br />
in this paper. 5,13 The speakers were stacked in a square all<br />
facing the same direction as shown in Fig. 8, <strong>and</strong> music was<br />
played through them �the same signal went to all four speakers�.<br />
The polarity of individual speakers was reversed by the<br />
switch box. When the switches were set so that all four<br />
speakers had the same phase as in Fig. 8�a�, so that the<br />
speaker arrangement acted like a monopole, the low frequencies<br />
in the music were quite audible. Reversing the polarity<br />
of two adjacent speakers produced a dipole source as in Fig.<br />
8�b� <strong>and</strong> �c�. This caused the bass frequencies to be significantly<br />
reduced while the middle <strong>and</strong> high frequencies were<br />
relatively unaffected. Matching the polarity of diagonal<br />
speakers produced a quadrupole source as in Fig. 8�d�. Now<br />
the bass frequencies were severely impaired <strong>and</strong> midrange<br />
frequencies were also reduced. This very simple demonstration<br />
makes a big impression on students.<br />
Figure 9 shows 1/3-octave measurements of the sound<br />
pressure level when pink noise was played through the<br />
speaker stack. A sound level meter was placed a distance of<br />
1 m from the speakers <strong>and</strong> approximately aligned with the<br />
center of the square. Figure 9�a� compares the sound spectrum<br />
produced by monopole <strong>and</strong> dipole arrangements. The<br />
low frequencies are greatly reduced, with midfrequencies<br />
slightly reduced, <strong>and</strong> high frequencies largely unaffected.<br />
Figure 9�b� compares the sound spectrum produced by<br />
monopole <strong>and</strong> quadrupole arrangements. Now both low <strong>and</strong><br />
middle frequencies have been severely reduced.<br />
V. SUMMARY<br />
A simple <strong>and</strong> inexpensive experiment using four 4-in.<br />
boxed loudspeakers very effectively demonstrates the angular<br />
distribution of the sound field radiated by acoustic monopole,<br />
dipole, <strong>and</strong> quadrupole sources. At low frequencies,<br />
each boxed speaker acts as a simple source, radiating sound<br />
equally in all directions. To observe directivity patterns the<br />
four speakers are symmetrically arranged on a rotating stool<br />
<strong>and</strong> the sound field is measured with a sound level meter as<br />
the stool is rotated through 360°. A simple switch box enables<br />
the polarity of each speaker to be reversed, allowing<br />
students to drive the speakers together as a monopole, or in<br />
pairs as <strong>dipoles</strong> <strong>and</strong> <strong>quadrupoles</strong>. Measured directivity patterns<br />
agree very well with theoretical predictions. Stacking<br />
the speakers <strong>and</strong> playing music through them demonstrates<br />
the relative efficiency of <strong>monopoles</strong>, <strong>dipoles</strong>, <strong>and</strong> <strong>quadrupoles</strong><br />
at producing low frequency sounds.<br />
a�<br />
Formerly GMI Engineering & Management Institute.<br />
1<br />
A. D. Pierce, <strong>Acoustic</strong>s, An Introduction to its Physical Principles <strong>and</strong><br />
Applications �<strong>Acoustic</strong>al Society of America, New York, 1989�, pp. 159–<br />
171.<br />
2<br />
A. P. Dowling, ‘‘Steady-State Radiation From Sources,’’ in Encyclopedia<br />
of <strong>Acoustic</strong>s, edited by M. J. Crocker �Wiley, New York, 1997�, Chap. 9,<br />
pp. 107–125.<br />
3<br />
M. H. Nayfeh <strong>and</strong> M. K. Brussel, Electricity <strong>and</strong> Magnetism �Wiley, New<br />
York, 1985�, pp. 58–69.<br />
4<br />
J. B. Marion <strong>and</strong> M. A. Heald, Classical Electromagnetic Radiation �Harcourt<br />
Brace Jovanovich, New York, 1980�, pp. 34–48.<br />
5<br />
E. Meyer <strong>and</strong> E. G. Neumann, Physical <strong>and</strong> Applied <strong>Acoustic</strong>s: An Introduction<br />
�Academic, New York, 1972�, pp. 154–160.<br />
6<br />
D. A. Russell, ‘‘Measuring the Directivity of a Loudspeaker with <strong>and</strong><br />
without a Baffle,’’ available on the WWW at: http://www.kettering.edu/<br />
�drussell/anvlabs1.html.<br />
7<br />
L. L. Beranek, <strong>Acoustic</strong>s �<strong>Acoustic</strong>al Society of America, New York,<br />
1986�, pp. 91–115.<br />
8<br />
L. E. Kinsler, A. R. Frey, A. B. Coppens, <strong>and</strong> J. V. S<strong>and</strong>ers, Fundamentals<br />
of <strong>Acoustic</strong>s �Wiley, New York, 1982�, pp. 167–172.<br />
9<br />
M. P. Norton, Fundamentals of Noise <strong>and</strong> Vibration Analysis for Engineers<br />
�Cambridge U.P., Cambridge, 1989�, pp. 125–145.<br />
10<br />
D. D. Reynolds, Engineering Principles of <strong>Acoustic</strong>s: Noise <strong>and</strong> Vibration<br />
Control �Allyn <strong>and</strong> Bacon, Boston, 1981�, pp. 531–594.<br />
11<br />
Optimus XTS 40 loudspeakers �4-in., 150–18 000 Hz� are available from<br />
Radio Shack �catalog No. 40-1991�. They are quite often on sale for<br />
$14.99.<br />
12<br />
Digital Sound Level Meter 33-2055 is available from Radio Shack for<br />
$59.99. An analog meter 33-2050 is available for $29.99.<br />
13<br />
T. D. Rossing, <strong>Acoustic</strong>s Laboratory Experiments �Northern Illinois U.P.,<br />
DeKalb, IL, 1982�, Experiment 41: Monopole, Dipole, <strong>and</strong> Quadrupole<br />
Sources.<br />
PREMATURE DISCLOSURE<br />
I wrote four letters explaining what I wanted <strong>and</strong> asking for hospitality. ...Back did not reply;<br />
Cohnen said that his grating was at the moment out of commission, because his institute was being<br />
rebuilt; Paschen told me that he liked my idea, <strong>and</strong> that he had just put one of his doctoral<br />
c<strong>and</strong>idates to work on it. I was furious at this unexpected answer, but the project must have come<br />
to naught, because I never heard any further news of it. Zeeman, a Nobel Prize winner <strong>and</strong> the<br />
discoverer of the celebrated Zeeman effect, told me to catch a train <strong>and</strong> come to Holl<strong>and</strong>.<br />
Emilio Segrè, A Mind Always in Motion—The Autobiography of Emilio Segrè �University of California Press, Berkeley,<br />
1993�, pp. 65–66.<br />
664 Am. J. Phys., Vol. 67, No. 8, August 1999 Russell, Titlow, <strong>and</strong> Bemmen<br />
664