The NimStim set of facial expressions - Children's Hospital Boston
The NimStim set of facial expressions - Children's Hospital Boston
The NimStim set of facial expressions - Children's Hospital Boston

Create successful ePaper yourself
Turn your PDF publications into a flip-book with our unique Google optimized e-Paper software.
variable (Ekman and Friesen, 1976; Mandal, 1987; Biehl et al., 1997;<br />
Wang and Markham, 1999; Mandal et al., 2001; Beaupre and Hess,<br />
2005). However, this type <strong>of</strong> statistic does not account for false<br />
positives (Erwin et al., 1992). Although proportion correct is reported<br />
here, we also report Cohen's kappa (Cohen, 1960), which is a chancecorrected<br />
measure <strong>of</strong> agreement between the intended expression and<br />
the participants' labels. <strong>The</strong>re were 672 stimuli resulting in 672 kappas.<br />
<strong>The</strong>se kappas were calculated to estimate concordance between the<br />
labels and the intended expression for each stimulus, examined within<br />
actor, separately for open- and closed-mouth conditions 4 . Since the<br />
‘none <strong>of</strong> the above” option was provided, this choice was considered<br />
incorrect in the kappa calculation just as other incorrect emotion labels<br />
were. Lastly, it was not anticipated that calm and neutral would be<br />
identified as two separate <strong>expressions</strong> during this labeling task since<br />
the perceptual differences between the faces are quite small relative to<br />
the differences between the other <strong>expressions</strong> tested. <strong>The</strong>refore,<br />
responses <strong>of</strong> “calm” or “neutral” were accepted as correct for both<br />
calm and neutral <strong>facial</strong> <strong>expressions</strong>.<br />
2.4.2. Reliability<br />
Because <strong>of</strong> the high test–retest reliability for most <strong>of</strong> the stimuli,<br />
calculating kappa was <strong>of</strong>ten mathematically intractable and did not<br />
appropriately reflect the concordance <strong>of</strong> ratings over time 5 . <strong>The</strong>refore,<br />
proportion agreement between the first and second ratings was used<br />
to quantify extent <strong>of</strong> reliability <strong>of</strong> each face stimulus.<br />
2.4.3. Validity <strong>of</strong> calm and neutral<br />
As with the validity ratings <strong>of</strong> the entire data <strong>set</strong>, we calculated<br />
proportion correct and kappas for each calm and neutral stimulus to<br />
estimate the concordance between emotion label (either “calm”,<br />
“neutral”, or“neither”) and intended expression within each actor.<br />
<strong>The</strong> answer “neither” was also counted as an incorrect response.<br />
3. Results<br />
3.1. Validity<br />
<strong>The</strong>re were two validity measures (proportion correct and kappa<br />
scores) for each stimulus, thus resulting in 672 proportion correct and<br />
kappa scores. <strong>The</strong>se 672 proportion correct and kappa scores are<br />
presented individually in Supplemental Tables 2a and 2b and in<br />
aggregate by actor (43 actors×2 mouth positions=86 scores) in<br />
Supplemental Table 3, but by expression (17 scores) for succinctness<br />
within this manuscript (Table 1; closed and open mouth separately).<br />
<strong>The</strong> overall proportion correct was high (mean=0.81 (S.D.=0.19),<br />
median=0.88). <strong>The</strong> overall concordance between raters' labels and<br />
the intended <strong>expressions</strong> was also high (mean kappa across<br />
stimuli=0.79 (S.D.=0.17); median kappa=0.83). Table 2 presents<br />
the confusion matrix for the labels chosen by participants, which<br />
represents the average proportion <strong>of</strong> target and non-target labels<br />
endorsed for each expression and shows that errors were fairly<br />
consistent for each expression (e.g., incorrect judgments for fear faces<br />
were usually mislabeled as “surprise”).<br />
4 <strong>The</strong>se calculations involved separate 2× 2 contingency tables for each intended<br />
emotion in which the accuracy <strong>of</strong> the ratings was cross-classified with intended<br />
emotion, examined at the level <strong>of</strong> actor. For instance, a stimulus was either fear or a<br />
non-fear face (e.g., happy, sad, surprise). Likewise, the corresponding label <strong>of</strong> that stimulus<br />
provided by the raters was either “fear” or not. All ratings (approximately 567 for the<br />
closed-mouth <strong>expressions</strong> (81 raters×7 <strong>expressions</strong>) and 729 for the open-mouth<br />
<strong>expressions</strong> (81 raters×9 <strong>expressions</strong>)) were used in each validity contingency table.<br />
5 <strong>The</strong> reliability paradigm resulted in quite limited variability in the cells <strong>of</strong> the<br />
contingency table (i.e., as a group, subjects rated faces nearly identically in the two<br />
sessions, resulting in very high agreement). Kappa is not appropriate for certain cases<br />
such as when there is very low (or very high) prevalence <strong>of</strong> events (Kraemer et al.,<br />
2002. Tutorial in biostatistics: Kappa coefficients in medical research. Statistics in<br />
Medicine 21, 2109–2129).<br />
ARTICLE IN PRESS<br />
4 N. Tottenham et al. / Psychiatry Research xxx (2009) xxx-xxx<br />
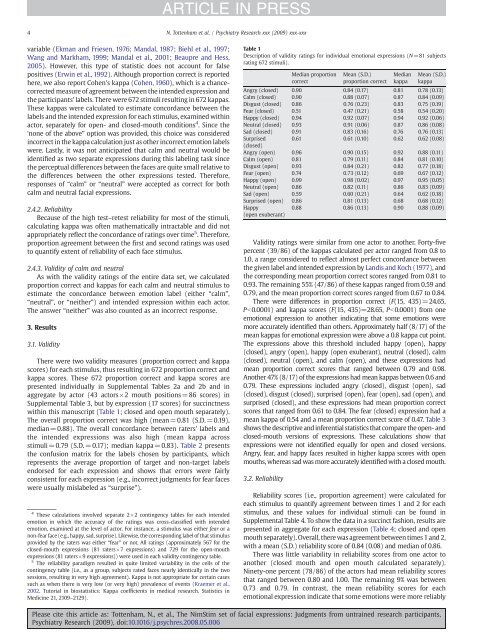
Table 1<br />
Description <strong>of</strong> validity ratings for individual emotional <strong>expressions</strong> (N=81 subjects<br />
rating 672 stimuli).<br />
Validity ratings were similar from one actor to another. Forty-five<br />
percent (39/86) <strong>of</strong> the kappas calculated per actor ranged from 0.8 to<br />
1.0, a range considered to reflect almost perfect concordance between<br />
the given label and intended expression by Landis and Koch (1977),and<br />
the corresponding mean proportion correct scores ranged from 0.81 to<br />
0.93. <strong>The</strong> remaining 55% (47/86) <strong>of</strong> these kappas ranged from 0.59 and<br />
0.79, and the mean proportion correct scores ranged from 0.67 to 0.84.<br />
<strong>The</strong>re were differences in proportion correct (F(15, 435)=24.65,<br />
Pb0.0001)andkappascores(F(15, 435)=28.65, Pb0.0001) from one<br />
emotional expression to another indicating that some emotions were<br />
more accurately identified than others. Approximately half (8/17) <strong>of</strong> the<br />
mean kappas for emotional expression were above a 0.8 kappa cut point.<br />
<strong>The</strong> <strong>expressions</strong> above this threshold included happy (open), happy<br />
(closed), angry (open), happy (open exuberant), neutral (closed), calm<br />
(closed), neutral (open), and calm (open), and these <strong>expressions</strong> had<br />
mean proportion correct scores that ranged between 0.79 and 0.98.<br />
Another 47% (8/17) <strong>of</strong> the <strong>expressions</strong> had mean kappas between 0.6 and<br />
0.79. <strong>The</strong>se <strong>expressions</strong> included angry (closed), disgust (open), sad<br />
(closed), disgust (closed), surprised (open), fear (open), sad (open), and<br />
surprised (closed), and these <strong>expressions</strong> had mean proportion correct<br />
scores that ranged from 0.61 to 0.84. <strong>The</strong> fear (closed) expression had a<br />
mean kappa <strong>of</strong> 0.54 and a mean proportion correct score <strong>of</strong> 0.47. Table 3<br />
shows the descriptive and inferential statistics that compare the open- and<br />
closed-mouth versions <strong>of</strong> <strong>expressions</strong>. <strong>The</strong>se calculations show that<br />
<strong>expressions</strong> were not identified equally for open and closed versions.<br />
Angry, fear, and happy faces resulted in higher kappa scores with open<br />
mouths, whereas sad was more accurately identified with a closed mouth.<br />
3.2. Reliability<br />
Median proportion<br />
correct<br />
Mean (S.D.)<br />
proportion correct<br />
Median<br />
kappa<br />
Mean (S.D.)<br />
kappa<br />
Angry (closed) 0.90 0.84 (0.17) 0.81 0.78 (0.13)<br />
Calm (closed) 0.90 0.88 (0.07) 0.87 0.84 (0.09)<br />
Disgust (closed) 0.86 0.76 (0.23) 0.83 0.75 (0.19)<br />
Fear (closed) 0.51 0.47 (0.21) 0.58 0.54 (0.20)<br />
Happy (closed) 0.94 0.92 (0.07) 0.94 0.92 (0.06)<br />
Neutral (closed) 0.93 0.91 (0.06) 0.87 0.86 (0.08)<br />
Sad (closed) 0.91 0.83 (0.16) 0.76 0.76 (0.13)<br />
Surprised<br />
(closed)<br />
0.61 0.61 (0.10) 0.62 0.62 (0.08)<br />
Angry (open) 0.96 0.90 (0.15) 0.92 0.88 (0.11)<br />
Calm (open) 0.81 0.79 (0.11) 0.84 0.81 (0.10)<br />
Disgust (open) 0.93 0.84 (0.21) 0.82 0.77 (0.18)<br />
Fear (open) 0.74 0.73 (0.12) 0.69 0.67 (0.12)<br />
Happy (open) 0.99 0.98 (0.02) 0.97 0.95 (0.05)<br />
Neutral (open) 0.86 0.82 (0.11) 0.86 0.83 (0.09)<br />
Sad (open) 0.59 0.60 (0.21) 0.64 0.62 (0.18)<br />
Surprised (open) 0.86 0.81 (0.13) 0.68 0.68 (0.12)<br />
Happy<br />
(open exuberant)<br />
0.88 0.86 (0.13) 0.90 0.88 (0.09)<br />
Reliability scores (i.e., proportion agreement) were calculated for<br />
each stimulus to quantify agreement between times 1 and 2 for each<br />
stimulus, and these values for individual stimuli can be found in<br />
Supplemental Table 4. To show the data in a succinct fashion, results are<br />
presented in aggregate for each expression (Table 4;closedandopen<br />
mouth separately). Overall, there was agreement between times 1 and 2,<br />
with a mean (S.D.) reliability score <strong>of</strong> 0.84 (0.08) and median <strong>of</strong> 0.86.<br />
<strong>The</strong>re was little variability in reliability scores from one actor to<br />
another (closed mouth and open mouth calculated separately).<br />
Ninety-one percent (78/86) <strong>of</strong> the actors had mean reliability scores<br />
that ranged between 0.80 and 1.00. <strong>The</strong> remaining 9% was between<br />
0.73 and 0.79. In contrast, the mean reliability scores for each<br />
emotional expression indicate that some emotions were more reliably<br />
Please cite this article as: Tottenham, N., et al., <strong>The</strong> <strong>NimStim</strong> <strong>set</strong> <strong>of</strong> <strong>facial</strong> <strong>expressions</strong>: Judgments from untrained research participants,<br />
Psychiatry Research (2009), doi:10.1016/j.psychres.2008.05.006