An Outdoor Thermal Comfort Index for the Subtropics
An Outdoor Thermal Comfort Index for the Subtropics
An Outdoor Thermal Comfort Index for the Subtropics

Create successful ePaper yourself
Turn your PDF publications into a flip-book with our unique Google optimized e-Paper software.
PLEA2009 - 26th Conference on Passive and Low Energy Architecture, Quebec City, Canada, 22-24 June 2009<br />
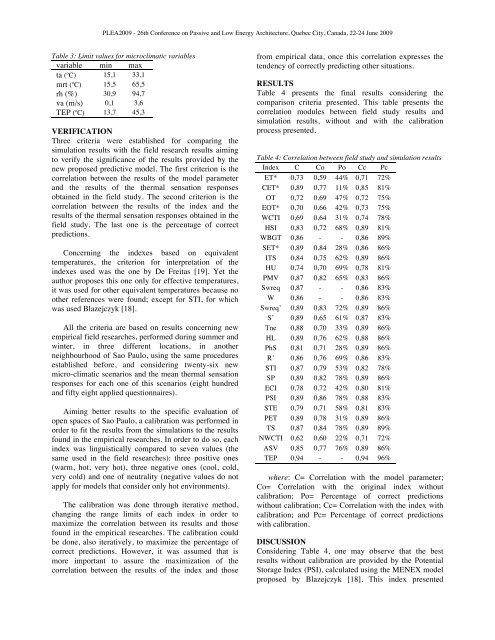
Table 3: Limit values <strong>for</strong> microclimatic variables<br />
variable min max<br />
ta ( o C) 15,1 33,1<br />
mrt ( o C) 15,5 65,5<br />
rh (%) 30,9 94,7<br />
va (m/s) 0,1 3,6<br />
TEP ( o C) 13,7 45,3<br />
VERIFICATION<br />
Three criteria were established <strong>for</strong> comparing <strong>the</strong><br />
simulation results with <strong>the</strong> field research results aiming<br />
to verify <strong>the</strong> significance of <strong>the</strong> results provided by <strong>the</strong><br />
new proposed predictive model. The first criterion is <strong>the</strong><br />
correlation between <strong>the</strong> results of <strong>the</strong> model parameter<br />
and <strong>the</strong> results of <strong>the</strong> <strong>the</strong>rmal sensation responses<br />
obtained in <strong>the</strong> field study. The second criterion is <strong>the</strong><br />
correlation between <strong>the</strong> results of <strong>the</strong> index and <strong>the</strong><br />
results of <strong>the</strong> <strong>the</strong>rmal sensation responses obtained in <strong>the</strong><br />
field study. The last one is <strong>the</strong> percentage of correct<br />
predictions.<br />
Concerning <strong>the</strong> indexes based on equivalent<br />
temperatures, <strong>the</strong> criterion <strong>for</strong> interpretation of <strong>the</strong><br />
indexes used was <strong>the</strong> one by De Freitas [19]. Yet <strong>the</strong><br />
author proposes this one only <strong>for</strong> effective temperatures,<br />
it was used <strong>for</strong> o<strong>the</strong>r equivalent temperatures because no<br />
o<strong>the</strong>r references were found; except <strong>for</strong> STI, <strong>for</strong> which<br />
was used Blazejczyk [18].<br />
All <strong>the</strong> criteria are based on results concerning new<br />
empirical field researches, per<strong>for</strong>med during summer and<br />
winter, in three different locations, in ano<strong>the</strong>r<br />
neighbourhood of Sao Paulo, using <strong>the</strong> same procedures<br />
established be<strong>for</strong>e, and considering twenty-six new<br />
micro-climatic scenarios and <strong>the</strong> mean <strong>the</strong>rmal sensation<br />
responses <strong>for</strong> each one of this scenarios (eight hundred<br />
and fifty eight applied questionnaires).<br />
Aiming better results to <strong>the</strong> specific evaluation of<br />
open spaces of Sao Paulo, a calibration was per<strong>for</strong>med in<br />
order to fit <strong>the</strong> results from <strong>the</strong> simulations to <strong>the</strong> results<br />
found in <strong>the</strong> empirical researches. In order to do so, each<br />
index was linguistically compared to seven values (<strong>the</strong><br />
same used in <strong>the</strong> field researches): three positive ones<br />
(warm, hot, very hot), three negative ones (cool, cold,<br />
very cold) and one of neutrality (negative values do not<br />
apply <strong>for</strong> models that consider only hot environments).<br />
The calibration was done through iterative method,<br />
changing <strong>the</strong> range limits of each index in order to<br />
maximize <strong>the</strong> correlation between its results and those<br />
found in <strong>the</strong> empirical researches. The calibration could<br />
be done, also iteratively, to maximize <strong>the</strong> percentage of<br />
correct predictions. However, it was assumed that is<br />
more important to assure <strong>the</strong> maximization of <strong>the</strong><br />
correlation between <strong>the</strong> results of <strong>the</strong> index and those<br />
from empirical data, once this correlation expresses <strong>the</strong><br />
tendency of correctly predicting o<strong>the</strong>r situations.<br />
RESULTS<br />
Table 4 presents <strong>the</strong> final results considering <strong>the</strong><br />
comparison criteria presented. This table presents <strong>the</strong><br />
correlation modules between field study results and<br />
simulation results, without and with <strong>the</strong> calibration<br />
process presented.<br />
Table 4: Correlation between field study and simulation results<br />
<strong>Index</strong> C Co Po Cc Pc<br />
ET* 0,73 0,59 44% 0,71 72%<br />
CET* 0,89 0,77 11% 0,85 81%<br />
OT 0,72 0,69 47% 0,72 75%<br />
EOT* 0,70 0,66 42% 0,73 75%<br />
WCTI 0,69 0,64 31% 0,74 78%<br />
HSI 0,83 0,72 68% 0,89 81%<br />
WBGT 0,86 - - 0,86 89%<br />
SET* 0,89 0,84 28% 0,86 86%<br />
ITS 0,84 0,75 62% 0,89 86%<br />
HU 0,74 0,70 69% 0,78 81%<br />
PMV 0,87 0,82 65% 0,83 86%<br />
Swreq 0,87 - - 0,86 83%<br />
W 0,86 - - 0,86 83%<br />
Swreq’ 0,89 0,83 72% 0,89 86%<br />
S’ 0,89 0,65 61% 0,87 83%<br />
Tne 0,88 0,70 33% 0,89 86%<br />
HL 0,89 0,76 62% 0,88 86%<br />
PhS 0,81 0,71 28% 0,89 86%<br />
R’ 0,86 0,76 69% 0,86 83%<br />
STI 0,87 0,79 53% 0,82 78%<br />
SP 0,89 0,82 78% 0,89 86%<br />
ECI 0,78 0,72 42% 0,80 81%<br />
PSI 0,89 0,86 78% 0,88 83%<br />
STE 0,79 0,71 58% 0,81 83%<br />
PET 0,89 0,78 31% 0,89 86%<br />
TS 0,87 0,84 78% 0,89 89%<br />
NWCTI 0,62 0,60 22% 0,71 72%<br />
ASV 0,85 0,77 76% 0,89 86%<br />
TEP 0,94 - - 0,94 96%<br />
where: C= Correlation with <strong>the</strong> model parameter;<br />
Co= Correlation with <strong>the</strong> original index without<br />
calibration; Po= Percentage of correct predictions<br />
without calibration; Cc= Correlation with <strong>the</strong> index with<br />
calibration; and Pc= Percentage of correct predictions<br />
with calibration.<br />
DISCUSSION<br />
Considering Table 4, one may observe that <strong>the</strong> best<br />
results without calibration are provided by <strong>the</strong> Potential<br />
Storage <strong>Index</strong> (PSI), calculated using <strong>the</strong> MENEX model<br />
proposed by Blazejczyk [18]. This index presented