
Create successful ePaper yourself
Turn your PDF publications into a flip-book with our unique Google optimized e-Paper software.
152 Rodr�guez-Navarro et al. 2008<br />
Table 1. Monthly temperature and humidity in the<br />
glasshouse.<br />
ments with nine replications were evaluated. In the first<br />
three treatments, mites were transferred manually (50,<br />
150 and 200 individuals) to the stems of field bindweed<br />
(McClay et al., 1999); in another three treatments infested<br />
stems with 3, 5 or 7 galls were twisted around healthy<br />
stems of field bindweed (Rodr�guez et al., 2004; Lauriault<br />
et al., 2002). For the final treatment, no plants were infested<br />
as the controls.<br />
Fifteen days after infestations a random sample was<br />
taken to check for the presence of symptoms on the<br />
treated plants. Mite specimens were mounted on slides using<br />
Hoyer’s medium and identified by comparison with<br />
A. malherbae characteristics (Nuzzaci et al., 1985).<br />
Sampling - The number of galls and the number of<br />
stems with galls were counted from all samples taken at<br />
15 day intervals from each of the pots. Mean temperature<br />
and humidity data for the duration of the trial were obtained<br />
from sensors connected to a Hobo H21-001<br />
climatologic station.<br />
Statistical analyses - To corroborate the normal<br />
distribution of data, the Kolmogorov-Smirnov; Cramervon<br />
Mises and Anderson-Darling (SAS, 2001) methods<br />
were used. Subsequently differences between sample<br />
means were tested by ANOVA and a regression analysis<br />
was done.<br />
RESULTS AND DISCUSSION<br />
Because sample data did not represent a normal distribution<br />
despite transformation, the analysis of variance<br />
was not applied to the mean values, and instead the<br />
non-parametric Kruskal-Wallis (Zar, 1996) method was<br />
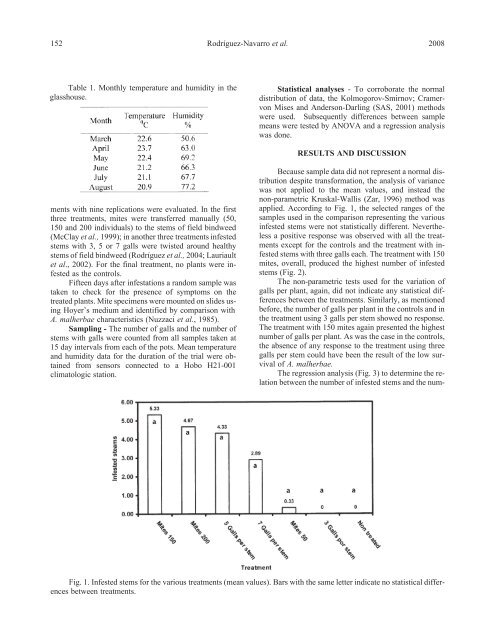
applied. According to Fig. 1, the selected ranges of the<br />
samples used in the comparison representing the various<br />
infested stems were not statistically different. Nevertheless<br />
a positive response was observed with all the treatments<br />
except for the controls and the treatment with infested<br />
stems with three galls each. The treatment with 150<br />
mites, overall, produced the highest number of infested<br />
stems (Fig. 2).<br />
The non-parametric tests used for the variation of<br />
galls per plant, again, did not indicate any statistical differences<br />
between the treatments. Similarly, as mentioned<br />
before, the number of galls per plant in the controls and in<br />
the treatment using 3 galls per stem showed no response.<br />
The treatment with 150 mites again presented the highest<br />
number of galls per plant. As was the case in the controls,<br />
the absence of any response to the treatment using three<br />
galls per stem could have been the result of the low survival<br />
of A. malherbae.<br />
The regression analysis (Fig. 3) to determine the relation<br />
between the number of infested stems and the num-<br />
Fig. 1. Infested stems for the various treatments (mean values). Bars with the same letter indicate no statistical differences<br />
between treatments.