

Dräger Instructional CD: Mechanical Ventilation - VentWorld
Dräger Instructional CD: Mechanical Ventilation - VentWorld
Dräger Instructional CD: Mechanical Ventilation - VentWorld

You also want an ePaper? Increase the reach of your titles
YUMPU automatically turns print PDFs into web optimized ePapers that Google loves.
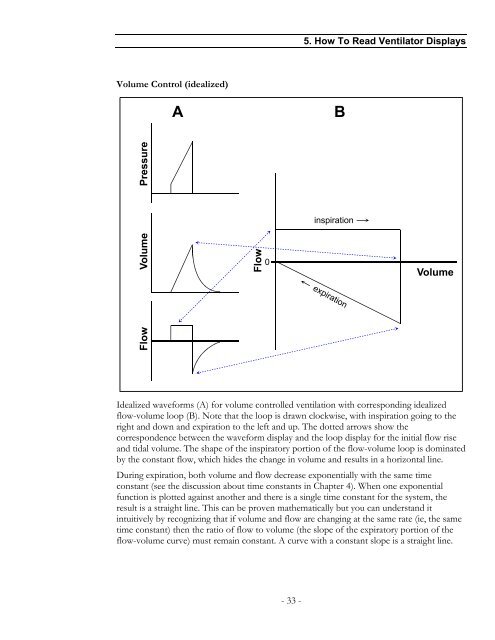
Volume Control (idealized)<br />
Pressure<br />
Volume<br />
Flow<br />
A B<br />
Flow<br />
0<br />
5. How To Read Ventilator Displays<br />
inspiration<br />
expiration<br />
Volume<br />
Idealized waveforms (A) for volume controlled ventilation with corresponding idealized<br />
flow-volume loop (B). Note that the loop is drawn clockwise, with inspiration going to the<br />
right and down and expiration to the left and up. The dotted arrows show the<br />
correspondence between the waveform display and the loop display for the initial flow rise<br />
and tidal volume. The shape of the inspiratory portion of the flow-volume loop is dominated<br />
by the constant flow, which hides the change in volume and results in a horizontal line.<br />
During expiration, both volume and flow decrease exponentially with the same time<br />
constant (see the discussion about time constants in Chapter 4). When one exponential<br />
function is plotted against another and there is a single time constant for the system, the<br />
result is a straight line. This can be proven mathematically but you can understand it<br />
intuitively by recognizing that if volume and flow are changing at the same rate (ie, the same<br />
time constant) then the ratio of flow to volume (the slope of the expiratory portion of the<br />
flow-volume curve) must remain constant. A curve with a constant slope is a straight line.<br />
- 33 -