IBERIA CASE STUDY - Ashridge
IBERIA CASE STUDY - Ashridge
IBERIA CASE STUDY - Ashridge

You also want an ePaper? Increase the reach of your titles
YUMPU automatically turns print PDFs into web optimized ePapers that Google loves.
MARKET SHARE EVOLUTION EUROPE‐LATIN AMERICA<br />
16.0%<br />
14.0%<br />
12.0%<br />
10.0%<br />
8.0%<br />
6.0%<br />
1998 1999 2000 2001 2002<br />
Iberia<br />
• More destinations<br />
• Higher numbers of non-stop flights<br />
• Higher daily frequency<br />
Air France<br />
KLM<br />
British Airways<br />
• Retrenching to business and point to<br />
point customers only<br />
Lufthansa<br />
Source: Iberia.com<br />
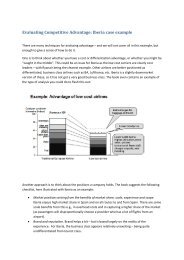
Iberia’s operational performance is mixed. Costs are high relative to the low cost carriers. However,<br />
unit costs are low relative to other national carriers.<br />
<strong>IBERIA</strong> UNIT COSTS BELOW TRADITIONAL AIRLINES<br />
Costs<br />
(Euro<br />
Cents/<br />
ASK**)<br />
14<br />
13<br />
12<br />
11<br />
10<br />
9<br />
8<br />
7<br />
6<br />
5<br />
SAS<br />
Low Cost Carriers<br />
EasyJet<br />
Ryan Air<br />
Lufthansa<br />
Air France<br />
Iberia<br />
600 800 1.000 1.200 1.400<br />
Iberia case study 3<br />
Average Stage Length (Kms)<br />
Austrian Airlines<br />
British Airways<br />
KLM<br />
1.600 1.800 2.000<br />
Date for period January – December 2002, except Ryanair and Easyjet fiscal year 2002.<br />
** Costs are Operating costs less 33% of Operating Leases. ASK is the number of seats<br />
times distance flown (a unit of capacity) Source: AEA, Iberia.com