

Commonalities of Georgia's 85/10 High Schools
Commonalities of Georgia's 85/10 High Schools
Commonalities of Georgia's 85/10 High Schools

You also want an ePaper? Increase the reach of your titles
YUMPU automatically turns print PDFs into web optimized ePapers that Google loves.
<strong>Commonalities</strong> <strong>of</strong> Georgia‘s <strong>85</strong>/<strong>10</strong> <strong>High</strong> <strong>Schools</strong><br />
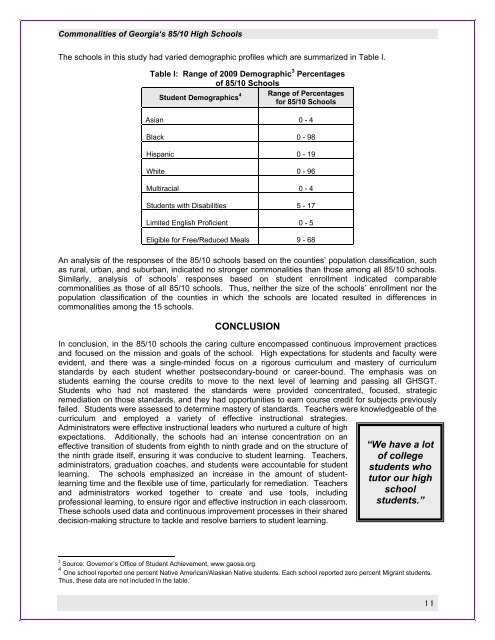
The schools in this study had varied demographic pr<strong>of</strong>iles which are summarized in Table I.<br />
Table I: Range <strong>of</strong> 2009 Demographic 3 Percentages<br />
<strong>of</strong> <strong>85</strong>/<strong>10</strong> <strong>Schools</strong><br />
Student Demographics 4 Range <strong>of</strong> Percentages<br />
for <strong>85</strong>/<strong>10</strong> <strong>Schools</strong><br />
Asian<br />
Black<br />
Hispanic<br />
White<br />
Multiracial<br />
Students with Disabilities<br />
0 - 4<br />
0 - 98<br />
0 - 19<br />
0 - 96<br />
0 - 4<br />
5 - 17<br />
Limited English Pr<strong>of</strong>icient 0 - 5<br />
Eligible for Free/Reduced Meals<br />
An analysis <strong>of</strong> the responses <strong>of</strong> the <strong>85</strong>/<strong>10</strong> schools based on the counties’ population classification, such<br />
as rural, urban, and suburban, indicated no stronger commonalities than those among all <strong>85</strong>/<strong>10</strong> schools.<br />
Similarly, analysis <strong>of</strong> schools’ responses based on student enrollment indicated comparable<br />
commonalities as those <strong>of</strong> all <strong>85</strong>/<strong>10</strong> schools. Thus, neither the size <strong>of</strong> the schools’ enrollment nor the<br />
population classification <strong>of</strong> the counties in which the schools are located resulted in differences in<br />
commonalities among the 15 schools.<br />
CONCLUSION<br />
In conclusion, in the <strong>85</strong>/<strong>10</strong> schools the caring culture encompassed continuous improvement practices<br />
and focused on the mission and goals <strong>of</strong> the school. <strong>High</strong> expectations for students and faculty were<br />
evident, and there was a single-minded focus on a rigorous curriculum and mastery <strong>of</strong> curriculum<br />
standards by each student whether postsecondary-bound or career-bound. The emphasis was on<br />
students earning the course credits to move to the next level <strong>of</strong> learning and passing all GHSGT.<br />
Students who had not mastered the standards were provided concentrated, focused, strategic<br />
remediation on those standards, and they had opportunities to earn course credit for subjects previously<br />
failed. Students were assessed to determine mastery <strong>of</strong> standards. Teachers were knowledgeable <strong>of</strong> the<br />
curriculum and employed a variety <strong>of</strong> effective instructional strategies.<br />
Administrators were effective instructional leaders who nurtured a culture <strong>of</strong> high<br />
9 - 68<br />
expectations. Additionally, the schools had an intense concentration on an<br />
effective transition <strong>of</strong> students from eighth to ninth grade and on the structure <strong>of</strong><br />
the ninth grade itself, ensuring it was conducive to student learning. Teachers,<br />
administrators, graduation coaches, and students were accountable for student<br />
learning. The schools emphasized an increase in the amount <strong>of</strong> studentlearning<br />
time and the flexible use <strong>of</strong> time, particularly for remediation. Teachers<br />
and administrators worked together to create and use tools, including<br />
pr<strong>of</strong>essional learning, to ensure rigor and effective instruction in each classroom.<br />
These schools used data and continuous improvement processes in their shared<br />
decision-making structure to tackle and resolve barriers to student learning.<br />
“We have a lot<br />
<strong>of</strong> college<br />
students who<br />
tutor our high<br />
school<br />
students.”<br />
3<br />
Source: Governor’s Office <strong>of</strong> Student Achievement, www.gaosa.org.<br />
4<br />
One school reported one percent Native American/Alaskan Native students. Each school reported zero percent Migrant students.<br />
Thus, these data are not included in the table.<br />
11