

Advance Data Tables 2013 Main Residency Match®
Advance Data Tables 2013 Main Residency Match®
Advance Data Tables 2013 Main Residency Match®

Create successful ePaper yourself
Turn your PDF publications into a flip-book with our unique Google optimized e-Paper software.
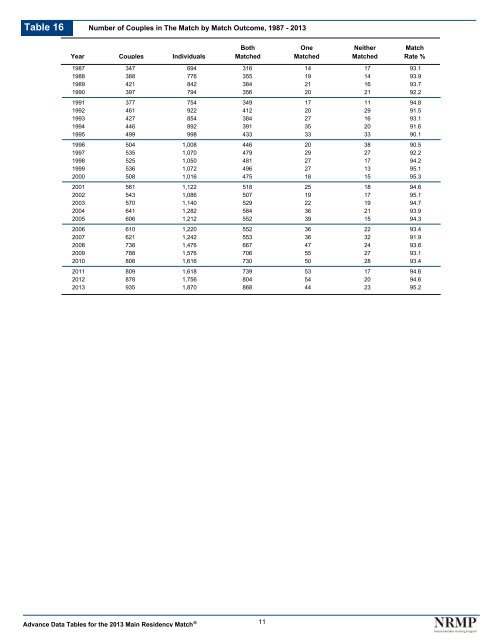
Table 16<br />
Year<br />
Number of Couples in The Match by Match Outcome, 1987 - <strong>2013</strong><br />
Couples<br />
Individuals<br />
Both<br />
Matched<br />
One<br />
Matched<br />
Neither<br />
Matched<br />
Match<br />
Rate %<br />
1987 347 694 316 14 17 93.1<br />
1988 388 776 355 19 14 93.9<br />
1989 421 842 384 21 16 93.7<br />
1990 397 794 356 20 21 92.2<br />
1991 377 754 349 17 11 94.8<br />
1992 461 922 412 20 29 91.5<br />
1993 427 854 384 27 16 93.1<br />
1994 446 892 391 35 20 91.6<br />
1995 499 998 433 33 33 90.1<br />
1996 504 1,008 446 20 38 90.5<br />
1997 535 1,070 479 29 27 92.2<br />
1998 525 1,050 481 27 17 94.2<br />
1999 536 1,072 496 27 13 95.1<br />
2000 508 1,016 475 18 15 95.3<br />
2001 561 1,122 518 25 18 94.6<br />
2002 543 1,086 507 19 17 95.1<br />
2003 570 1,140 529 22 19 94.7<br />
2004 641 1,282 584 36 21 93.9<br />
2005 606 1,212 552 39 15 94.3<br />
2006 610 1,220 552 36 22 93.4<br />
2007 621 1,242 553 36 32 91.9<br />
2008 738 1,476 667 47 24 93.6<br />
2009 788 1,576 706 55 27 93.1<br />
2010 808 1,616 730 50 28 93.4<br />
2011 809 1,618 739 53 17 94.6<br />
2012 878 1,756 804 54 20 94.6<br />
<strong>2013</strong> 935 1,870 868 44 23 95.2<br />
<strong>Advance</strong> <strong>Data</strong> <strong>Tables</strong> for the <strong>2013</strong> <strong>Main</strong> <strong>Residency</strong> <strong>Match®</strong><br />
11