The Allen Telescope Array Twenty-centimeter Survey—A - CIRA
The Allen Telescope Array Twenty-centimeter Survey—A - CIRA
The Allen Telescope Array Twenty-centimeter Survey—A - CIRA

Create successful ePaper yourself
Turn your PDF publications into a flip-book with our unique Google optimized e-Paper software.
– 22 –<br />
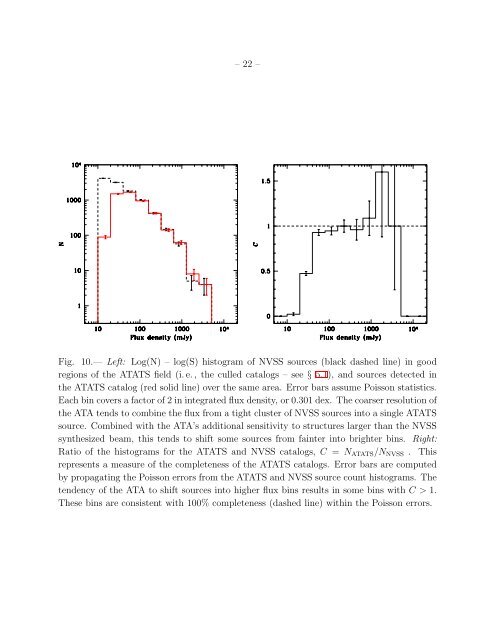
Fig. 10.— Left: Log(N) – log(S) histogram of NVSS sources (black dashed line) in good<br />
regions of the ATATS field (i.e., the culled catalogs – see § 5.1), and sources detected in<br />
the ATATS catalog (red solid line) over the same area. Error bars assume Poisson statistics.<br />
Eachbincovers afactorof2inintegratedfluxdensity, or0.301dex. <strong>The</strong>coarser resolutionof<br />
the ATA tends to combine the flux from a tight cluster of NVSS sources into a single ATATS<br />
source. Combined with the ATA’s additional sensitivity to structures larger than the NVSS<br />
synthesized beam, this tends to shift some sources from fainter into brighter bins. Right:<br />
Ratio of the histograms for the ATATS and NVSS catalogs, C = NATATS/NNVSS . This<br />
represents a measure of the completeness of the ATATS catalogs. Error bars are computed<br />
by propagating the Poisson errors from the ATATS and NVSS source count histograms. <strong>The</strong><br />
tendency of the ATA to shift sources into higher flux bins results in some bins with C > 1.<br />
<strong>The</strong>se bins are consistent with 100% completeness (dashed line) within the Poisson errors.