SALARY TABLE 2012-GL (LEO) SPECIAL BASE RATES FOR LAW ...
SALARY TABLE 2012-GL (LEO) SPECIAL BASE RATES FOR LAW ...
SALARY TABLE 2012-GL (LEO) SPECIAL BASE RATES FOR LAW ...

Create successful ePaper yourself
Turn your PDF publications into a flip-book with our unique Google optimized e-Paper software.
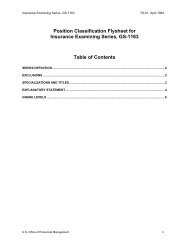
<strong>SALARY</strong> <strong>TABLE</strong> <strong>2012</strong>-HOU (<strong>LEO</strong>)<br />
INCLUDING <strong>SPECIAL</strong> <strong>BASE</strong> <strong>RATES</strong> AT GS-3 THROUGH GS-10 AND<br />
INCORPORATING A LOCALITY PAYMENT OF 28.71%<br />
<strong>FOR</strong> THE LOCALITY PAY AREA OF HOUSTON-BAYTOWN-HUNTSVILLE, TX<br />
(See http://www.opm.gov/oca/12tables/locdef.asp for definitions of locality pay areas.)<br />
<strong>RATES</strong> FROZEN AT 2010 LEVELS<br />
EFFECTIVE JANUARY <strong>2012</strong><br />
Annual Rates by Grade and Step<br />
x Grade Step 1 Step 2 Step 3 Step 4 Step 5 Step 6 Step 7 Step 8 Step 9 Step 10<br />
1 $ 22,914 $ 23,680 $ 24,442 $ 25,200 $ 25,962 $ 26,410 $ 27,163 $ 27,922 $ 27,952 $ 28,662<br />
2 25,764 26,377 27,229 27,952 28,266 29,097 29,929 30,760 31,592 32,423<br />
3 33,732 34,669 35,606 36,543 37,480 38,417 39,354 40,291 41,228 42,165<br />
4 37,866 38,918 39,970 41,021 42,073 43,124 44,176 45,227 46,279 47,331<br />
5 43,541 44,718 45,894 47,071 48,247 49,423 50,600 51,776 52,953 54,129<br />
6 45,913 47,225 48,537 49,848 51,160 52,471 53,783 55,094 56,406 57,717<br />
7 49,568 51,026 52,484 53,942 55,401 56,859 58,317 59,775 61,234 62,692<br />
8 51,663 53,277 54,891 56,505 58,119 59,733 61,347 62,961 64,575 66,189<br />
9 55,278 57,061 58,844 60,626 62,409 64,192 65,974 67,757 69,539 71,322<br />
10 60,876 62,840 64,804 66,768 68,732 70,697 72,661 74,625 76,589 78,553<br />
11 64,724 66,882 69,039 71,196 73,353 75,510 77,667 79,825 81,982 84,139<br />
12 77,579 80,164 82,750 85,336 87,922 90,508 93,093 95,679 98,265 100,851<br />
13 92,252 95,326 98,401 101,476 104,551 107,626 110,701 113,776 116,851 119,926<br />
14 109,014 112,647 116,280 119,914 123,547 127,181 130,814 134,448 138,081 141,715<br />
15 128,231 132,506 136,780 141,055 145,329 149,603 153,878 155,500 * 155,500 * 155,500 *<br />
* Rate limited to the rate for level IV of the Executive Schedule (5 U.S.C. 5304 (g)(1)).<br />
NOTE: Locality pay rates for law enforcement officers (<strong>LEO</strong>s) at grades 03 through 10 are computed using special base pay rates for <strong>LEO</strong>s (as defined in 5 U.S.C. 5541(3)<br />
and 5 CFR 550.103) authorized by section 403 of the Federal Employees Pay Comparability Act of 1990, as amended.