Alternative Methods for the Median Lethal Dose (LD50) Test: The Up ...
Alternative Methods for the Median Lethal Dose (LD50) Test: The Up ...
Alternative Methods for the Median Lethal Dose (LD50) Test: The Up ...

Create successful ePaper yourself
Turn your PDF publications into a flip-book with our unique Google optimized e-Paper software.
to-animal, inter- and intralaboratory species, strain, sex,<br />
age, and housing variability. Such simulations have shown<br />
that <strong>the</strong> new sampling technique used in <strong>the</strong> UDP has a<br />
much better chance of placing <strong>the</strong> estimated LD 50 close to<br />
<strong>the</strong> value that was used in defining <strong>the</strong> underlying hypo<strong>the</strong>tical<br />
population even when <strong>the</strong> starting dose is inappropriate<br />
(ICCVAM 2001, Appendix 0-2). This type of<br />
comparison would not be practical using actual animal tests<br />
because it would be impossible to determine whe<strong>the</strong>r each<br />
small sample tested is providing correct or incorrect estimates<br />
of <strong>the</strong> underlying population.<br />
Actual animal testing was not necessary <strong>for</strong> determination<br />
of <strong>the</strong> validity of <strong>the</strong> new statistical design. It is not<br />
appropriate or possible to compare changes in sampling<br />
technique or to assess <strong>the</strong> ability of a new statistical design<br />
to accurately estimate <strong>the</strong> mean and standard deviation of<br />
<strong>the</strong> population based on <strong>the</strong> results of a few runs of a test<br />
because <strong>the</strong>re is no way to determine <strong>the</strong> goodness of fit of<br />
<strong>the</strong> statistical procedure from a few samples. However,<br />
computer simulations can be used to compare <strong>the</strong> results of<br />
thousands of individual hypo<strong>the</strong>tical tests. By using a large<br />
series of such simulations and varying starting dose, dose<br />
progression, and assumptions about and of <strong>the</strong> underlying<br />
population, it is possible to test how often a new<br />
statistical sampling technique will accurately estimate <strong>the</strong><br />
LD 50 and , or standard deviation, of <strong>the</strong> population.<br />
Stopping Rule<br />
Simulations revealed that <strong>the</strong> number of test subjects needed<br />
to provide an acceptable degree of accuracy depends, in<br />
part, on <strong>the</strong> slope of <strong>the</strong> dose-response curve of <strong>the</strong> test<br />
population. However, in most cases, <strong>the</strong> slope is not known<br />
in advance of testing. <strong>The</strong>re<strong>for</strong>e, to allow <strong>the</strong> up-and-down<br />
method to be applied to a wide variety of chemicals with<br />
reasonable reliability, a flexible stopping rule using criteria<br />
based on an index related to <strong>the</strong> statistical error was developed<br />
and incorporated into <strong>the</strong> test. <strong>The</strong> testing stops when<br />
one of <strong>the</strong> following stopping criteria is met (EPA 2001;<br />
ICCVAM 2001):<br />
1. Three consecutive animals survive at <strong>the</strong> upper bound<br />
of dosing, where <strong>the</strong> upper bound of testing is <strong>the</strong> highest<br />
dose given to <strong>the</strong> animals, based on regulatory<br />
needs. Normally, <strong>the</strong> upper bound of dosing is 2000 or<br />
5000 mg/kg.<br />
2. Five reversals occur in any six consecutive animals<br />
tested;<br />
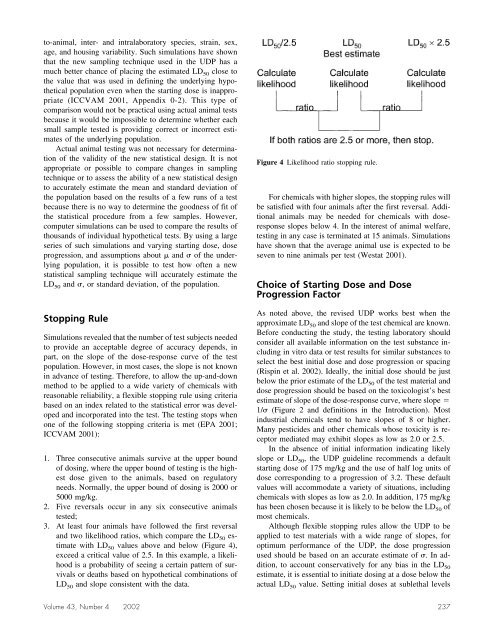
3. At least four animals have followed <strong>the</strong> first reversal<br />
and two likelihood ratios, which compare <strong>the</strong> LD 50 estimate<br />
with LD 50 values above and below (Figure 4),<br />
exceed a critical value of 2.5. In this example, a likelihood<br />
is a probability of seeing a certain pattern of survivals<br />
or deaths based on hypo<strong>the</strong>tical combinations of<br />
LD 50 and slope consistent with <strong>the</strong> data.<br />
Figure 4 Likelihood ratio stopping rule.<br />
For chemicals with higher slopes, <strong>the</strong> stopping rules will<br />
be satisfied with four animals after <strong>the</strong> first reversal. Additional<br />
animals may be needed <strong>for</strong> chemicals with doseresponse<br />
slopes below 4. In <strong>the</strong> interest of animal welfare,<br />
testing in any case is terminated at 15 animals. Simulations<br />
have shown that <strong>the</strong> average animal use is expected to be<br />
seven to nine animals per test (Westat 2001).<br />
Choice of Starting <strong>Dose</strong> and <strong>Dose</strong><br />
Progression Factor<br />
As noted above, <strong>the</strong> revised UDP works best when <strong>the</strong><br />
approximate LD 50 and slope of <strong>the</strong> test chemical are known.<br />
Be<strong>for</strong>e conducting <strong>the</strong> study, <strong>the</strong> testing laboratory should<br />
consider all available in<strong>for</strong>mation on <strong>the</strong> test substance including<br />
in vitro data or test results <strong>for</strong> similar substances to<br />
select <strong>the</strong> best initial dose and dose progression or spacing<br />
(Rispin et al. 2002). Ideally, <strong>the</strong> initial dose should be just<br />
below <strong>the</strong> prior estimate of <strong>the</strong> LD 50 of <strong>the</strong> test material and<br />
dose progression should be based on <strong>the</strong> toxicologist’s best<br />
estimate of slope of <strong>the</strong> dose-response curve, where slope <br />
1/ (Figure 2 and definitions in <strong>the</strong> Introduction). Most<br />
industrial chemicals tend to have slopes of 8 or higher.<br />
Many pesticides and o<strong>the</strong>r chemicals whose toxicity is receptor<br />
mediated may exhibit slopes as low as 2.0 or 2.5.<br />
In <strong>the</strong> absence of initial in<strong>for</strong>mation indicating likely<br />
slope or LD 50, <strong>the</strong> UDP guideline recommends a default<br />
starting dose of 175 mg/kg and <strong>the</strong> use of half log units of<br />
dose corresponding to a progression of 3.2. <strong>The</strong>se default<br />
values will accommodate a variety of situations, including<br />
chemicals with slopes as low as 2.0. In addition, 175 mg/kg<br />
has been chosen because it is likely to be below <strong>the</strong> LD 50 of<br />
most chemicals.<br />
Although flexible stopping rules allow <strong>the</strong> UDP to be<br />
applied to test materials with a wide range of slopes, <strong>for</strong><br />
optimum per<strong>for</strong>mance of <strong>the</strong> UDP, <strong>the</strong> dose progression<br />
used should be based on an accurate estimate of . Inaddition,<br />
to account conservatively <strong>for</strong> any bias in <strong>the</strong> LD 50<br />
estimate, it is essential to initiate dosing at a dose below <strong>the</strong><br />
actual LD 50 value. Setting initial doses at sublethal levels<br />
Volume 43, Number 4 2002 237