The 2010 Census - Milken Institute
The 2010 Census - Milken Institute
The 2010 Census - Milken Institute

Create successful ePaper yourself
Turn your PDF publications into a flip-book with our unique Google optimized e-Paper software.
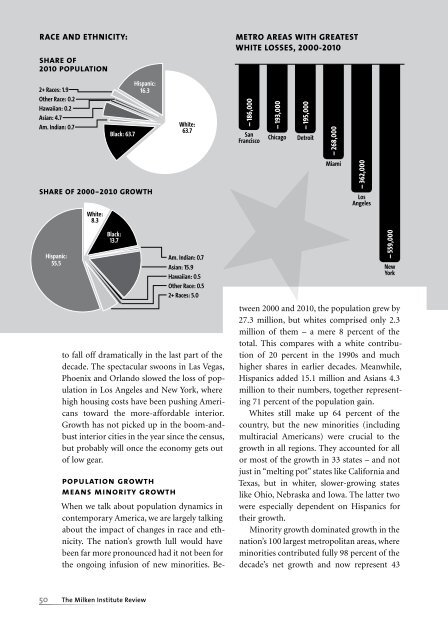
RACE AND ETHNICITY:<br />
SHARE OF<br />
<strong>2010</strong> POPULATION<br />
2+ Races: 1.9<br />
Other Race: 0.2<br />
Hawaiian: 0.2<br />
Asian: 4.7<br />
Am. Indian: 0.7<br />
SHARE OF 2000-<strong>2010</strong> GROWTH<br />
Hispanic:<br />
55.5<br />
White:<br />
8.3<br />
Black: 63.7<br />
Black:<br />
13.7<br />
Hispanic:<br />
16.3<br />
to fall off dramatically in the last part of the<br />
decade. <strong>The</strong> spectacular swoons in Las Vegas,<br />
Phoenix and Orlando slowed the loss of population<br />
in Los Angeles and New York, where<br />
high housing costs have been pushing Americans<br />
toward the more-affordable interior.<br />
Growth has not picked up in the boom-andbust<br />
interior cities in the year since the census,<br />
but probably will once the economy gets out<br />
of low gear.<br />
population growth<br />
means minority growth<br />
When we talk about population dynamics in<br />
contemporary America, we are largely talking<br />
about the impact of changes in race and ethnicity.<br />
<strong>The</strong> nation’s growth lull would have<br />
been far more pronounced had it not been for<br />
the ongoing infusion of new minorities. Be-<br />
50 <strong>The</strong> <strong>Milken</strong> <strong>Institute</strong> Review<br />
White:<br />
63.7<br />
Am. Indian: 0.7<br />
Asian: 15.9<br />
Hawaiian: 0.5<br />
Other Race: 0.5<br />
2+ Races: 5.0<br />
METRO AREAS WITH GREATEST<br />
WHITE LOSSES, 2000-<strong>2010</strong><br />
— 186,000<br />
San<br />
Francisco<br />
— 193,000<br />
— 195,000<br />
Chicago Detroit<br />
— 268,000<br />
Miami<br />
— 362,000<br />
Los<br />
Angeles<br />
— 559,000<br />
New<br />
York<br />
tween 2000 and <strong>2010</strong>, the population grew by<br />
27.3 million, but whites comprised only 2.3<br />
million of them – a mere 8 percent of the<br />
total. This compares with a white contribution<br />
of 20 percent in the 1990s and much<br />
higher shares in earlier decades. Meanwhile,<br />
Hispanics added 15.1 million and Asians 4.3<br />
million to their numbers, together representing<br />
71 percent of the population gain.<br />
Whites still make up 64 percent of the<br />
country, but the new minorities (including<br />
multiracial Americans) were crucial to the<br />
growth in all regions. <strong>The</strong>y accounted for all<br />
or most of the growth in 33 states – and not<br />
just in “melting pot” states like California and<br />
Texas, but in whiter, slower-growing states<br />
like Ohio, Nebraska and Iowa. <strong>The</strong> latter two<br />
were especially dependent on Hispanics for<br />
their growth.<br />
Minority growth dominated growth in the<br />
nation’s 100 largest metropolitan areas, where<br />
minorities contributed fully 98 percent of the<br />
decade’s net growth and now represent 43