Selective Sampling for Example-based Word Sense Disambiguation
Selective Sampling for Example-based Word Sense Disambiguation
Selective Sampling for Example-based Word Sense Disambiguation

You also want an ePaper? Increase the reach of your titles
YUMPU automatically turns print PDFs into web optimized ePapers that Google loves.
Computational Linguistics Volume 24, Number 4<br />
100<br />
95<br />
90<br />
85<br />
' ' ~5 • J<br />
80 i<br />
60 70 80 90<br />
coverage (%)<br />
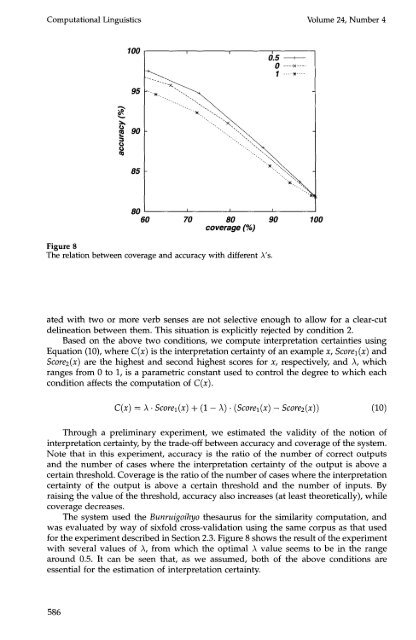
Figure 8<br />
The relation between coverage and accuracy with different A's.<br />
O ----X ....<br />
ated with two or more verb senses are not selective enough to allow <strong>for</strong> a clear-cut<br />
delineation between them. This situation is explicitly rejected by condition 2.<br />
Based on the above two conditions, we compute interpretation certainties using<br />
Equation (10), where C(x) is the interpretation certainty of an example x, Scorel(x) and<br />
Score2(x) are the highest and second highest scores <strong>for</strong> x, respectively, and ,~, which<br />
ranges from 0 to 1, is a parametric constant used to control the degree to which each<br />
condition affects the computation of C(x).<br />
C(x)=A. Scorel(x)+(1 - ~).(Scorel(x) - Score2(x)) (10)<br />
Through a preliminary experiment, we estimated the validity of the notion of<br />
interpretation certainty, by the trade-off between accuracy and coverage of the system.<br />
Note that in this experiment, accuracy is the ratio of the number of correct outputs<br />
and the number of cases where the interpretation certainty of the output is above a<br />
certain threshold. Coverage is the ratio of the number of cases where the interpretation<br />
certainty of the output is above a certain threshold and the number of inputs. By<br />
raising the value of the threshold, accuracy also increases (at least theoretically), while<br />
coverage decreases.<br />
The system used the Bunruigoihyo thesaurus <strong>for</strong> the similarity computation, and<br />
was evaluated by way of sixfold cross-validation using the same corpus as that used<br />
<strong>for</strong> the experiment described in Section 2.3. Figure 8 shows the result of the experiment<br />
with several values of ,~, from which the optimal )~ value seems to be in the range<br />
around 0.5. It can be seen that, as we assumed, both of the above conditions are<br />
essential <strong>for</strong> the estimation of interpretation certainty.<br />
586<br />
100