2012 - Florida Department of Agriculture and Consumer Services
2012 - Florida Department of Agriculture and Consumer Services
2012 - Florida Department of Agriculture and Consumer Services

You also want an ePaper? Increase the reach of your titles
YUMPU automatically turns print PDFs into web optimized ePapers that Google loves.
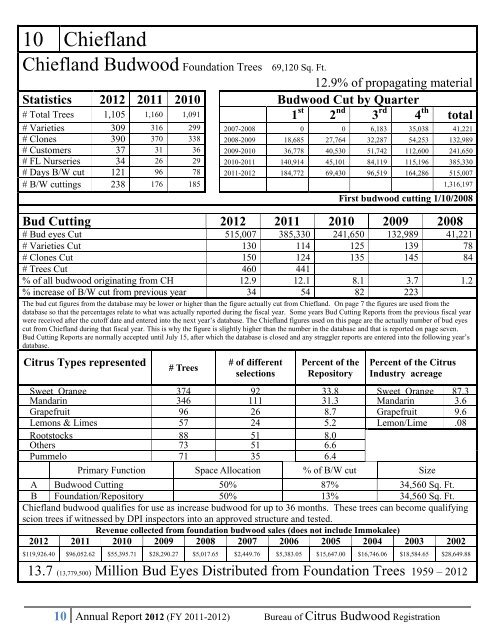
10 Chiefl<strong>and</strong><br />
Chiefl<strong>and</strong> Budwood Foundation Trees 69,120 Sq. Ft.<br />
Statistics <strong>2012</strong> 2011 2010<br />
12.9% <strong>of</strong> propagating material<br />
Budwood Cut by Quarter<br />
# Total Trees 1,105 1,160 1,091 1 st 2 nd 3 rd 4 th total<br />
# Varieties 309 316 299 2007-2008 0 0 6,183 35,038 41,221<br />
# Clones 390 370 338 2008-2009 18,685 27,764 32,287 54,253 132,989<br />
# Customers 37 31 36 2009-2010 36,778 40,530 51,742 112,600 241,650<br />
# FL Nurseries 34 26 29 2010-2011 140,914 45,101 84,119 115,196 385,330<br />
# Days B/W cut 121 96 78 2011-<strong>2012</strong> 184,772 69,430 96,519 164,286 515,007<br />
# B/W cuttings 238 176 185 1,316,197<br />
First budwood cutting 1/10/2008<br />
Bud Cutting <strong>2012</strong> 2011 2010 2009 2008<br />
# Bud eyes Cut 515,007 385,330 241,650 132,989 41,221<br />
# Varieties Cut 130 114 125 139 78<br />
# Clones Cut 150 124 135 145 84<br />
# Trees Cut 460 441<br />
% <strong>of</strong> all budwood originating from CH 12.9 12.1 8.1 3.7 1.2<br />
% increase <strong>of</strong> B/W cut from previous year 34 54 82 223<br />
The bud cut figures from the database may be lower or higher than the figure actually cut from Chiefl<strong>and</strong>. On page 7 the figures are used from the<br />
database so that the percentages relate to what was actually reported during the fiscal year. Some years Bud Cutting Reports from the previous fiscal year<br />
were received after the cut<strong>of</strong>f date <strong>and</strong> entered into the next year’s database. The Chiefl<strong>and</strong> figures used on this page are the actually number <strong>of</strong> bud eyes<br />
cut from Chiefl<strong>and</strong> during that fiscal year. This is why the figure is slightly higher than the number in the database <strong>and</strong> that is reported on page seven.<br />
Bud Cutting Reports are normally accepted until July 15, after which the database is closed <strong>and</strong> any straggler reports are entered into the following year’s<br />
database.<br />
Citrus Types represented<br />
# Trees<br />
# <strong>of</strong> different<br />
selections<br />
Percent <strong>of</strong> the<br />
Repository<br />
Percent <strong>of</strong> the Citrus<br />
Industry acreage<br />
Sweet Orange 374 92 33.8 Sweet Orange 87.3<br />
M<strong>and</strong>arin 346 111 31.3 M<strong>and</strong>arin 3.6<br />
Grapefruit 96 26 8.7 Grapefruit 9.6<br />
Lemons & Limes 57 24 5.2 Lemon/Lime .08<br />
Rootstocks 88 51 8.0<br />
Others 73 51 6.6<br />
Pummelo 71 35 6.4<br />
Primary Function Space Allocation % <strong>of</strong> B/W cut Size<br />
A Budwood Cutting 50% 87% 34,560 Sq. Ft.<br />
B Foundation/Repository 50% 13% 34,560 Sq. Ft.<br />
Chiefl<strong>and</strong> budwood qualifies for use as increase budwood for up to 36 months. These trees can become qualifying<br />
scion trees if witnessed by DPI inspectors into an approved structure <strong>and</strong> tested.<br />
Revenue collected from foundation budwood sales (does not include Immokalee)<br />
<strong>2012</strong> 2011 2010 2009 2008 2007 2006 2005 2004 2003 2002<br />
$119,926.40 $96,052.62 $55,395.71 $28,290.27 $5,017.65 $2,449.76 $5,383.05 $15,647.00 $16,746.06 $18,584.65 $28,649.88<br />
13.7 (13,779,500) Million Bud Eyes Distributed from Foundation Trees 1959 – <strong>2012</strong><br />
10 Annual Report <strong>2012</strong> (FY 2011-<strong>2012</strong>) Bureau <strong>of</strong> Citrus Budwood Registration