Certified Coding Specialist (CCS) JOB ANALYSIS American Health ...
Certified Coding Specialist (CCS) JOB ANALYSIS American Health ...
Certified Coding Specialist (CCS) JOB ANALYSIS American Health ...

You also want an ePaper? Increase the reach of your titles
YUMPU automatically turns print PDFs into web optimized ePapers that Google loves.
RESULTS<br />
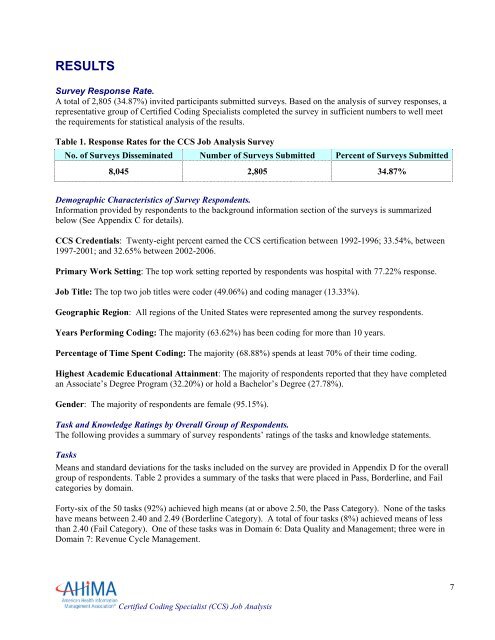
Survey Response Rate.<br />
A total of 2,805 (34.87%) invited participants submitted surveys. Based on the analysis of survey responses, a<br />
representative group of <strong>Certified</strong> <strong>Coding</strong> <strong>Specialist</strong>s completed the survey in sufficient numbers to well meet<br />
the requirements for statistical analysis of the results.<br />
Table 1. Response Rates for the <strong>CCS</strong> Job Analysis Survey<br />
No. of Surveys Disseminated Number of Surveys Submitted Percent of Surveys Submitted<br />
8,045 2,805 34.87%<br />
Demographic Characteristics of Survey Respondents.<br />
Information provided by respondents to the background information section of the surveys is summarized<br />
below (See Appendix C for details).<br />
<strong>CCS</strong> Credentials: Twenty-eight percent earned the <strong>CCS</strong> certification between 1992-1996; 33.54%, between<br />
1997-2001; and 32.65% between 2002-2006.<br />
Primary Work Setting: The top work setting reported by respondents was hospital with 77.22% response.<br />
Job Title: The top two job titles were coder (49.06%) and coding manager (13.33%).<br />
Geographic Region: All regions of the United States were represented among the survey respondents.<br />
Years Performing <strong>Coding</strong>: The majority (63.62%) has been coding for more than 10 years.<br />
Percentage of Time Spent <strong>Coding</strong>: The majority (68.88%) spends at least 70% of their time coding.<br />
Highest Academic Educational Attainment: The majority of respondents reported that they have completed<br />
an Associate’s Degree Program (32.20%) or hold a Bachelor’s Degree (27.78%).<br />
Gender: The majority of respondents are female (95.15%).<br />
Task and Knowledge Ratings by Overall Group of Respondents.<br />
The following provides a summary of survey respondents’ ratings of the tasks and knowledge statements.<br />
Tasks<br />
Means and standard deviations for the tasks included on the survey are provided in Appendix D for the overall<br />
group of respondents. Table 2 provides a summary of the tasks that were placed in Pass, Borderline, and Fail<br />
categories by domain.<br />
Forty-six of the 50 tasks (92%) achieved high means (at or above 2.50, the Pass Category). None of the tasks<br />
have means between 2.40 and 2.49 (Borderline Category). A total of four tasks (8%) achieved means of less<br />
than 2.40 (Fail Category). One of these tasks was in Domain 6: Data Quality and Management; three were in<br />
Domain 7: Revenue Cycle Management.<br />
<strong>Certified</strong> <strong>Coding</strong> <strong>Specialist</strong> (<strong>CCS</strong>) Job Analysis<br />
7