Jerry Landye, Beth McCasland, Carol Hart, and Karl Hayden, Fish ...
Jerry Landye, Beth McCasland, Carol Hart, and Karl Hayden, Fish ...
Jerry Landye, Beth McCasland, Carol Hart, and Karl Hayden, Fish ...
You also want an ePaper? Increase the reach of your titles
YUMPU automatically turns print PDFs into web optimized ePapers that Google loves.
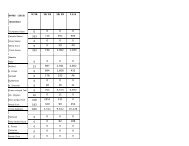
Table 1. San Juan River C. latipinnis fish health biologists’ inspection data for abnormalities,<br />
10/94 - 5/99:<br />
Date # of fish sampled # of fish with<br />
abnormalities<br />
10/94 95 5 5<br />
5/95 99 8 8<br />
10/95 100 5 5<br />
5/96 100 19 19<br />
10/96 100 4 4<br />
5/97 100 1 1<br />
10/97 110 1 0.9<br />
5/98 80 2 2.5<br />
5/99 80 3 3.8<br />
percent of fish with<br />
abnormalities<br />
During the May 1996 survey, the health of the sucker populations were in poor condition compared to all<br />
other survey periods. <strong>Fish</strong> health biologists not only sampled the r<strong>and</strong>omly selected C. latipinnis, but<br />
also necropsied an additional 231 fish. These fish were mostly suckers <strong>and</strong> were selected due to<br />
abnormalities. Of these 331 fish examined, 145 had lesions. More fish with abnormalities were<br />
observed during the 1993 survey than during any other survey, with biologists saving abnormal fish for<br />
the fish health biologists. During 1997-1999, fish health biologists have observed only an occasional<br />
lesion, with no concentration of abnormalities in a specific area of the river.<br />
<strong>Fish</strong>ery biologist data: <strong>Fish</strong>ery biologist data included all fish species collected <strong>and</strong> abnormalities<br />
observed. Utilizing the data for C. latipinnis <strong>and</strong> C. discobolus, survey periods were compared (Table 2).<br />
This provided a large number of suckers in the data base <strong>and</strong> changes in frequencies of abnormalities<br />
from each river mile provided trends of probable problem areas of the San Juan River. The discrepancy<br />
in values between fishery biologist <strong>and</strong> fish health biologist data is explained by the fish health<br />
biologists’ ability to observe pathology more carefully with more time allotted to fish health. The lower<br />
fishery biologist abnormality incidence values may be attributed in part by the inclusion of C. discobolus<br />
values which lowered the overall abnormality incidence rate. However, the same trend in abnormality<br />
incidences was observed in both data sets from each type of survey.<br />
3


