

Volume 13, Issue 1 - Ontario Onsite Wastewater Association
Volume 13, Issue 1 - Ontario Onsite Wastewater Association
Volume 13, Issue 1 - Ontario Onsite Wastewater Association

Create successful ePaper yourself
Turn your PDF publications into a flip-book with our unique Google optimized e-Paper software.
<strong>13</strong> th Annual <strong>Onsite</strong> <strong>Wastewater</strong> Conference & Exhibition<br />
located under the lamellar separator that, once a day, transferred sludge<br />
produced by the EC unit to the primary reactor. Domestic wastewater was<br />
fed into the system at a flow rate of 400 GPD by applying the NSF 40 dosing<br />
protocol: 25% of the daily volume (Qd) from 6 a.m. to 9 a.m., 35% of Qd<br />
from 11 a.m. to 2 p.m., and 40% from 5 p.m. to 8 p.m. Sampling over 24hour<br />
periods was done every 2 weeks. The second approach involved a<br />
self-cleaning UV disinfection unit used to disinfect secondary level treated<br />
effluent. The self-cleaning UV unit consisted of a central quartz tube that<br />
received the effluent to be treated and in which stainless steel blades<br />
rotated to clean the quartz tube 6 times a day to overcome quartz tube<br />
fouling (Sehnaoui,K. and Gehr, R. 2001). Two UV lamps were installed on<br />
each side of the central quartz tube, with a parabolic reflector to maximize<br />
UV radiation (Patented Crossfire Technology®).<br />
This disinfection unit was extensively tested at two (2) different sites.<br />
In both cases, the wastewater treatment unit included a septic tank<br />
followed by an equalization tank and a rotating biological contactor in<br />
front of the self-cleaning UV unit. The UV unit was fed by a pump at a<br />
regulated flow rate of 15 GPM. The first system was used to service a<br />
new subdivision of 100 homes, producing a design flow rate of 27,000<br />
GPD. Sampling at this site was done for 24 months. The second system<br />
treated the wastewater produced by a restaurant at a flow rate of 4,000<br />
GPD. Its performance was evaluated over a period of 36 months.<br />
The third approach was based on a membrane biological reactor<br />
(MBR) that produced a tertiary level treatment, including very low<br />
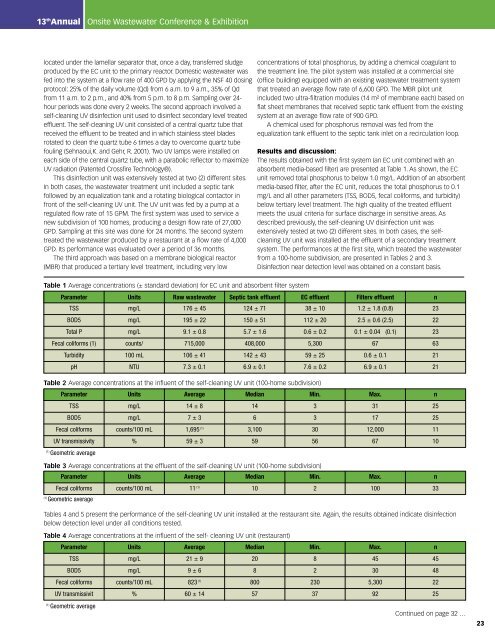
Table 1 Average concentrations (± standard deviation) for EC unit and absorbent filter system<br />
concentrations of total phosphorus, by adding a chemical coagulant to<br />
the treatment line. The pilot system was installed at a commercial site<br />
(office building) equipped with an existing wastewater treatment system<br />
that treated an average flow rate of 6,600 GPD. The MBR pilot unit<br />
included two ultra-filtration modules (14 m² of membrane each) based on<br />
flat sheet membranes that received septic tank effluent from the existing<br />
system at an average flow rate of 900 GPD.<br />
A chemical used for phosphorus removal was fed from the<br />
equalization tank effluent to the septic tank inlet on a recirculation loop.<br />
Results and discussion:<br />
The results obtained with the first system (an EC unit combined with an<br />
absorbent media-based filter) are presented at Table 1. As shown, the EC<br />
unit removed total phosphorus to below 1.0 mg/L. Addition of an absorbent<br />
media-based filter, after the EC unit, reduces the total phosphorus to 0.1<br />
mg/L and all other parameters (TSS, BOD5, fecal coliforms, and turbidity)<br />
below tertiary level treatment. The high quality of the treated effluent<br />
meets the usual criteria for surface discharge in sensitive areas. As<br />
described previously, the self-cleaning UV disinfection unit was<br />
extensively tested at two (2) different sites. In both cases, the selfcleaning<br />
UV unit was installed at the effluent of a secondary treatment<br />
system. The performances at the first site, which treated the wastewater<br />
from a 100-home subdivision, are presented in Tables 2 and 3.<br />
Disinfection near detection level was obtained on a constant basis.<br />
Parameter Units Raw wastewater Septic tank effluent EC effluent Filterv effluent n<br />
TSS mg/L 176 ± 45 124 ± 71 38 ± 10 1.2 ± 1.8 (0.8) 23<br />
BOD5 mg/L 195 ± 22 150 ± 51 112 ± 20 2.5 ± 0.6 (2.5) 22<br />
Total P mg/L 9.1 ± 0.8 5.7 ± 1.6 0.6 ± 0.2 0.1 ± 0.04 (0.1) 23<br />
Fecal coliforms (1) counts/ 715,000 408,000 5,300 67 63<br />
Turbidity 100 mL 106 ± 41 142 ± 43 59 ± 25 0.6 ± 0.1 21<br />
pH NTU 7.3 ± 0.1 6.9 ± 0.1 7.6 ± 0.2 6.9 ± 0.1 21<br />
Table 2 Average concentrations at the influent of the self-cleaning UV unit (100-home subdivision)<br />
Parameter Units Average Median Min. Max. n<br />
TSS mg/L 14 ± 8 14 3 31 25<br />
BOD5 mg/L 7 ± 3 6 3 17 25<br />
Fecal coliforms counts/100 mL 1,695 (1) 3,100 30 12,000 11<br />
UV transmissivity % 59 ± 3 59 56 67 10<br />
(1) Geometric average<br />
Table 3 Average concentrations at the effluent of the self-cleaning UV unit (100-home subdivision)<br />
Parameter Units Average Median Min. Max. n<br />
Fecal coliforms counts/100 mL 11 (1) (1) Geometric average<br />
10 2 100 33<br />
Tables 4 and 5 present the performance of the self-cleaning UV unit installed at the restaurant site. Again, the results obtained indicate disinfection<br />
below detection level under all conditions tested.<br />
Table 4 Average concentrations at the influent of the self- cleaning UV unit (restaurant)<br />
Parameter Units Average Median Min. Max. n<br />
TSS mg/L 21 ± 9 20 8 45 45<br />
BOD5 mg/L 9 ± 6 8 2 30 48<br />
Fecal coliforms counts/100 mL 823 (1) 800 230 5,300 22<br />
UV transmissivit % 60 ± 14 57 37 92 25<br />
(1) Geometric average<br />
Continued on page 32 …<br />
23