

Bicycle-account-2010-Copenhagen
Bicycle-account-2010-Copenhagen
Bicycle-account-2010-Copenhagen

You also want an ePaper? Increase the reach of your titles
YUMPU automatically turns print PDFs into web optimized ePapers that Google loves.
target goals<br />
and key figures<br />
harsh winters take<br />
their toll<br />
The proportion of bicycle trips to work and<br />
study in <strong>Copenhagen</strong> dropped from 37 % in<br />
2008 to 35 % in <strong>2010</strong>, primarily due to the<br />
harsh winter months at the beginning and<br />
end of <strong>2010</strong>. This is borne out by the fact<br />
that the figure for the total number of cycled<br />
kilometres increased. The proportion of<br />
bicycle trips is calculated on the basis of total<br />
annual traffic while the total number of<br />
cycled kilometres is calculated on the basis<br />
of traffic censuses taken in the spring and<br />
the fall. In other words, leaving the winter<br />
months out of <strong>account</strong>, cycling increased<br />
in <strong>2010</strong> in relation to previous years. Apart<br />
from the 35 % who cycle the whole trip to<br />
work or study, 1 percentage point out of the<br />
32 % of those who use public transport to<br />
work or study finish their trip by bicycle.<br />
people are safer and<br />
feel safer in traffiC<br />
There has been a marked increase in the<br />
perceived safety from 51 % in 2008 to<br />
67 % in <strong>2010</strong>, thereby reversing an otherwise<br />
clear downward trend in cyclists’<br />
sense of safety since 1996. Today only 5 %<br />
of city cyclists respond that they feel very<br />
unsafe. At the same time the level of cyclist<br />
safety is historically high: 92 seriously<br />
injured cyclists in <strong>2010</strong> as against 252 in<br />
1996. This positive trend is due to an organized<br />
effort to improve safety and security<br />
in traffic. Advanced stop lines and more<br />
and wider cycle tracks have made cycling in<br />
traffic safer and more secure. However, a<br />
continued, intensified effort is necessary if<br />
we are to achieve our goal that 80 % of city<br />
cyclists shall feel safe in traffic by 2015.<br />
alMost everybody CyCles<br />
84 % of <strong>Copenhagen</strong> residents have access<br />
to a bicycle and 68 % cycle at least<br />
once a week. Even among those who<br />
cite the car or public transport as their<br />
primary transport mode, 15 % cycle at<br />
least once a week. As many as 50 % of<br />
<strong>Copenhagen</strong> residents who work or study<br />
in <strong>Copenhagen</strong> cycle to their workplace or<br />
educational institution.<br />
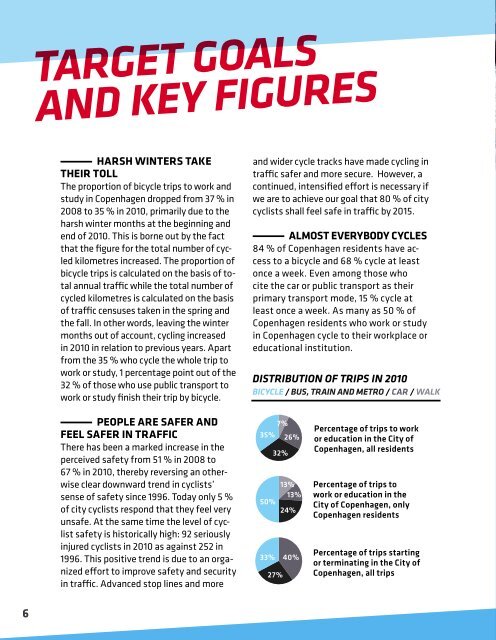
distribution of trips in <strong>2010</strong><br />
biCyCle / bus, train and metro / Car / Walk<br />
7%<br />
35% 26%<br />
13%<br />
13%<br />
50%<br />
24%<br />
33%<br />
32%<br />
27%<br />
40%<br />
percentage of trips to work<br />
or education in the city of<br />
copenhagen, all residents<br />
percentage of trips to<br />
work or education in the<br />
city of copenhagen, only<br />
copenhagen residents<br />
percentage of trips starting<br />
or terminating in the city of<br />
copenhagen, all trips<br />
the three target goals for 2015 from the City<br />
of <strong>Copenhagen</strong>’s poliCy, 'eCo-metropolis – our<br />
Vision for <strong>Copenhagen</strong> 2015'<br />
• At least 50 % will go to their place of work or education by bike.<br />
• the number of killed and seriously injured copenhagen cyclists will<br />
be reduced by more than 50 % compared to 2005.<br />
• At least 80 % of copenhagen cyclists will feel safe in traffic.<br />
96 98 00 02 04 06 08 10 15<br />
eCo-metropolis – target goals<br />
percentage that cycle to work<br />
or education (%)<br />
seriously injured cyclists<br />
30 30 34 32 36 36 37 35 50<br />
(number per year)<br />
percentage of cyclists that<br />
252 173 146 152 125 97 121 92 56<br />
feel safe (%) 60 58 57 56 58 53 51 67 80<br />
other key figures<br />
cycled kilometers<br />
(mil. km per weekday)<br />
cycled km between serious<br />
0.93 0.92 1.05 1.11 1.13 1.15 1.17 1.21<br />
casualties (mil. km)<br />
cycling speed<br />
1.2 1.8 2.4 2.4 3.0 4.0 3.2 4.4<br />
(km/h)<br />
cycle tracks<br />
15.3 16.0 16.2 15.8<br />
(km)<br />
cycle lanes<br />
294 302 307 323 329 332 338 346<br />
(km)<br />
green cycle routes<br />
6 10 12 14 17 18 23<br />
(km)<br />
cycle parking spaces on roads<br />
29 30 31 32 37 39 41 42<br />
and pavements (1000 pcs)* 42 47 48<br />
* New method of calculation, which is why the figures have been adjusted in relation to the<br />
<strong>Bicycle</strong> Accounts of 2006 and 2008.<br />
6 7