Serving Up MyPlate-A Yummy Curriculum, Level 2 - Team Nutrition ...
Serving Up MyPlate-A Yummy Curriculum, Level 2 - Team Nutrition ...
Serving Up MyPlate-A Yummy Curriculum, Level 2 - Team Nutrition ...

You also want an ePaper? Increase the reach of your titles
YUMPU automatically turns print PDFs into web optimized ePapers that Google loves.
a. Any three of the following: regular<br />
potato chips, French fries, bacon, hot<br />
dog, regular butter, chocolate chip<br />
cookies<br />
b. Any three of the following: banana<br />
slices, reduced-fat baked potato chips,<br />
apple slices, graham crackers, nuts<br />
Before starting the experiment, ask students<br />
to predict which food has the highest fat<br />
content, and which has the lowest. They should<br />
note these predictions on their handouts.<br />
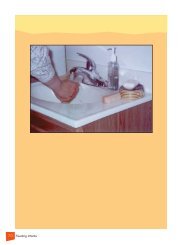
10. Students should first label each of the paper-bag<br />
squares with the name of a food they will be testing.<br />
Next, they will rub or crush a piece of the food onto<br />
the paper-bag square. Remind students to rub each<br />
food for the same amount of time (for example, rub<br />
the food back and forth across the paper square 10<br />
times). Allow the paper bags to sit overnight. This<br />
way, any moisture caused by water content from the<br />
foods can evaporate, and what is left on the paper<br />
bag is fat only.<br />
Part B: Solid Fats Experiment (20 minutes)<br />
Day 2:<br />
11. Students should check the results the following day.<br />
Which food left a grease/oil/fat spot? Ask: Which<br />
food has the highest fat content? Which foods have<br />
the lowest amounts of fat (a smaller or no grease<br />
spot)? How does this compare to their predictions?<br />
What conclusions can students draw about their own<br />
consumption of foods with high fat content from this<br />
experiment? Give students a few minutes to think<br />
about and write out their analysis and conclusions.<br />
12. Conclude the experiment with a discussion allowing<br />
students to share their observations, predictions,<br />
and conclusions. Of these foods, are there any that<br />
you think might contain heart-healthy oils as the<br />
fat instead of solid fats? Nuts and seeds contain<br />
heart-healthy oils, as do some fish, avocados, and<br />
olives. Which of the foods tested have the lowest fat<br />
content? Fruits and vegetables tend to be naturally<br />
low in solid fats — unless solid fats are added during<br />
cooking (like putting butter on vegetables).<br />
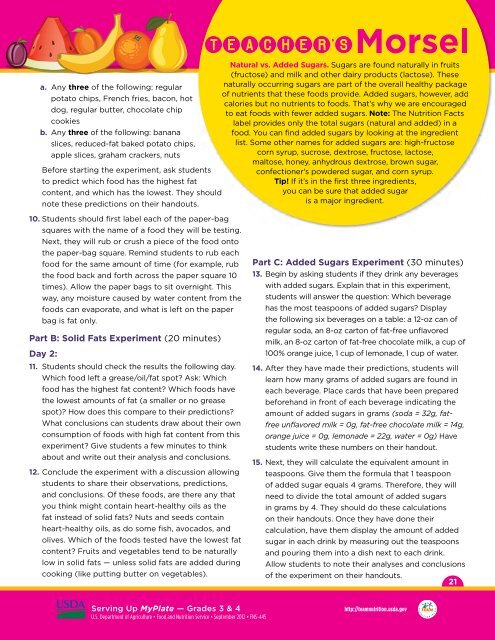
Part C: Added Sugars Experiment (30 minutes)<br />
13. Begin by asking students if they drink any beverages<br />
with added sugars. Explain that in this experiment,<br />
students will answer the question: Which beverage<br />
has the most teaspoons of added sugars? Display<br />
the following six beverages on a table: a 12-oz can of<br />
regular soda, an 8-oz carton of fat-free unflavored<br />
milk, an 8-oz carton of fat-free chocolate milk, a cup of<br />
100% orange juice, 1 cup of lemonade, 1 cup of water.<br />
14. After they have made their predictions, students will<br />
learn how many grams of added sugars are found in<br />
each beverage. Place cards that have been prepared<br />
beforehand in front of each beverage indicating the<br />
amount of added sugars in grams (soda = 32g, fatfree<br />
unflavored milk = 0g, fat-free chocolate milk = 14g,<br />
orange juice = 0g, lemonade = 22g, water = 0g) Have<br />
students write these numbers on their handout.<br />
15. Next, they will calculate the equivalent amount in<br />
teaspoons. Give them the formula that 1 teaspoon<br />
of added sugar equals 4 grams. Therefore, they will<br />
need to divide the total amount of added sugars<br />
in grams by 4. They should do these calculations<br />
on their handouts. Once they have done their<br />
calculation, have them display the amount of added<br />
sugar in each drink by measuring out the teaspoons<br />
and pouring them into a dish next to each drink.<br />
Allow students to note their analyses and conclusions<br />
of the experiment on their handouts.<br />
21<br />
<strong>Serving</strong> <strong>Up</strong> <strong>MyPlate</strong> — Grades 3 & 4 http://teamnutrition.usda.gov<br />
U.S. Department of Agriculture • Food and <strong>Nutrition</strong> Service • September 2012 • FNS-445