Annual Report 2011 - Pou Sheng International (Holdings) Limited
Annual Report 2011 - Pou Sheng International (Holdings) Limited
Annual Report 2011 - Pou Sheng International (Holdings) Limited

Create successful ePaper yourself
Turn your PDF publications into a flip-book with our unique Google optimized e-Paper software.
<strong>Annual</strong> <strong>Report</strong> <strong>2011</strong><br />
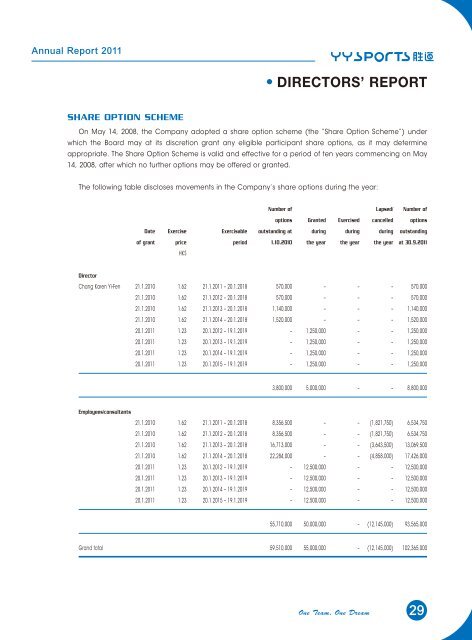
SHARE OPTION SCHEME<br />
DIRECTORS’ REPORT<br />
On May 14, 2008, the Company adopted a share option scheme (the “Share Option Scheme”) under<br />
which the Board may at its discretion grant any eligible participant share options, as it may determine<br />
appropriate. The Share Option Scheme is valid and effective for a period of ten years commencing on May<br />
14, 2008, after which no further options may be offered or granted.<br />
The following table discloses movements in the Company’s share options during the year:<br />
Number of Lapsed/ Number of<br />
options Granted Exercised cancelled options<br />
Date Exercise Exercisable outstanding at during during during outstanding<br />
of grant price<br />
HK$<br />
period 1.10.2010 the year the year the year at 30.9.<strong>2011</strong><br />
Director<br />
Chang Karen Yi-Fen 21.1.2010 1.62 21.1.<strong>2011</strong> – 20.1.2018 570,000 – – – 570,000<br />
21.1.2010 1.62 21.1.2012 – 20.1.2018 570,000 – – – 570,000<br />
21.1.2010 1.62 21.1.2013 – 20.1.2018 1,140,000 – – – 1,140,000<br />
21.1.2010 1.62 21.1.2014 – 20.1.2018 1,520,000 – – – 1,520,000<br />
20.1.<strong>2011</strong> 1.23 20.1.2012 – 19.1.2019 – 1,250,000 – – 1,250,000<br />
20.1.<strong>2011</strong> 1.23 20.1.2013 – 19.1.2019 – 1,250,000 – – 1,250,000<br />
20.1.<strong>2011</strong> 1.23 20.1.2014 – 19.1.2019 – 1,250,000 – – 1,250,000<br />
20.1.<strong>2011</strong> 1.23 20.1.2015 – 19.1.2019 – 1,250,000 – – 1,250,000<br />
Employees/consultants<br />
3,800,000 5,000,000 – – 8,800,000<br />
21.1.2010 1.62 21.1.<strong>2011</strong> – 20.1.2018 8,356,500 – – (1,821,750) 6,534,750<br />
21.1.2010 1.62 21.1.2012 – 20.1.2018 8,356,500 – – (1,821,750) 6,534,750<br />
21.1.2010 1.62 21.1.2013 – 20.1.2018 16,713,000 – – (3,643,500) 13,069,500<br />
21.1.2010 1.62 21.1.2014 – 20.1.2018 22,284,000 – – (4,858,000) 17,426,000<br />
20.1.<strong>2011</strong> 1.23 20.1.2012 – 19.1.2019 – 12,500,000 – – 12,500,000<br />
20.1.<strong>2011</strong> 1.23 20.1.2013 – 19.1.2019 – 12,500,000 – – 12,500,000<br />
20.1.<strong>2011</strong> 1.23 20.1.2014 – 19.1.2019 – 12,500,000 – – 12,500,000<br />
20.1.<strong>2011</strong> 1.23 20.1.2015 – 19.1.2019 – 12,500,000 – – 12,500,000<br />
55,710,000 50,000,000 – (12,145,000) 93,565,000<br />
Grand total 59,510,000 55,000,000 – (12,145,000) 102,365,000<br />
One Team, One Dream<br />
29