alerian oot - American Herbal Pharmacopoeia
alerian oot - American Herbal Pharmacopoeia
alerian oot - American Herbal Pharmacopoeia

Create successful ePaper yourself
Turn your PDF publications into a flip-book with our unique Google optimized e-Paper software.
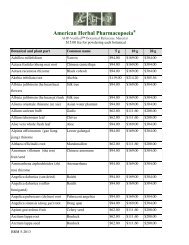
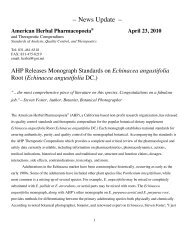
In Figure 14, valerenic acid is seen as a strong single band at R f 0.48. In the V.<br />
officinalis samples, three bands of decreasing intensity are seen above this band. A<br />
sharp band is seen at R f 0.25.<br />
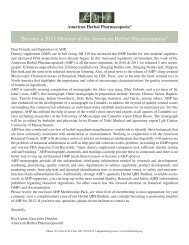
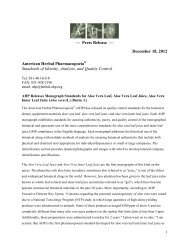
In Figure 15, valerenic acid is seen as a very faint violet band at R f 0.48. In the V.<br />
officinalis samples, the band at R f 0.25 is olive green with a light violet band directly<br />
above. Another light blue band appears at R f 0.4. An olive green and two gray bands<br />
are present at an approximate R f of 0.56, 0.62, and 0.85, respectively.<br />
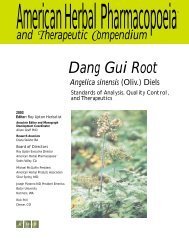
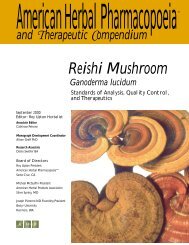
In Figure 16, valerenic acid is seen as a weak fluorescent band at R f 0.48. At the<br />
same R f, a blue and a pink band with two broad red bands directly above are seen in<br />
the V. officinalis samples. There is also a blue band at R f 0.85 and a blue fluorescence<br />
band at R f 0.25<br />
In Figure 17, valerenic acid is seen as a strong dark blue band. Depending on the<br />
purity of the standard, two more bands may appear at a lower R f. The V. officinalis<br />
samples test show prominent dark blue bands of valerenic acid at R f 0.48 and one or<br />
two dark blue bands at R f 0.85. Two or three violet bands are seen between R f 0.5 and<br />
R f 0.8. Two blue bands are seen below the valerenic acid band.<br />
High Performance Liquid Chromatography (HPLC)<br />
for Valerenic Acid<br />
For quantitative analysis of valerenic acid, a modification of the method of Hänsel<br />
and Schulz was adopted (Hänsel and Schulz 1982). This same method formed the<br />
basis for the method proposed by the Pharmacopeial Convention (USP) for inclusion<br />
in the National Formulary (Pharmacopeial Forum 1998). It provides good separation<br />
of valerenic acid, acetoxyvalerenic acid, and hydroxyvalerenic acid, and the aldehyde<br />
valerenal. In Europe, and in some analytical laboratories in the United States, total<br />
valerenic acid content is calculated as the sum of these compounds. In the USP proposal,<br />
only valerenic acid content is determined. These differences in calculating<br />
valerenic acid content cause confusion and incongruities in the marketplace.<br />
Calculation of total valerenic acid values (the sum of valerenic acid, acetoxyvalerenic<br />
acid, hydroxyvalerenic acid, and valerenal) is more representative of effective v<strong>alerian</strong><br />
products than determination of valerenic acid alone. Additionally, some analytical<br />
laboratories calculate total valerenic acids using each reference standard while others<br />
calculate total valerenic acids based on the assumption that the extinction coefficients<br />
for each compound are the same. The extinction coefficients of each compound are<br />
not the same. However, calculating total valerenic acids in this manner provides a<br />
more accurate determination of total valerenic acid values than the calculation of<br />
valerenic acid alone. For a more accurate determination of total valerenic acids, laboratories<br />
are encouraged to determine the extinction coefficients of the three primary<br />
compounds. Valerenic acid is available and is relatively inexpensive. Standards for<br />
acetoxyvalerenic acid and hydroxy valerenic acid are available and are relatively<br />
expensive. Standards for valerenal are not available but it is considered to have the<br />
same extinction coefficient as valerenic acid.<br />
Sample Preparation<br />
For analysis of crude v<strong>alerian</strong> r<strong>oot</strong>, weigh 2 g of finely powdered r<strong>oot</strong> material and<br />
transfer to a 100 mL volumetric flask. Dilute to volume with methanol:water (80:20)<br />
and sonicate for 30 minutes. Filter a portion through a 0.45 µm filter into an HPLC<br />
vial or centrifuge to obtain a clear test solution.<br />
For analysis of powdered extracts, weigh 100 mg of extract into a 10 mL volumetric<br />
flask. Dilute to volume with methanol:water (80:20) and sonicate for 15 minutes.<br />
Filter a portion through a 0.45 µm filter into an HPLC vial or centrifuge to<br />
obtain a clear test solution.<br />
Characterization of various V<strong>alerian</strong>a spp<br />
by TLC (see Figures 14-17)<br />
All of the V. officinalis samples tested were identical<br />
with the exception of the Dutch sample. V.<br />
sitchensis and V. wallichi give significantly different<br />
chromatograms. Information about differentiating<br />
between the species is provided below. No<br />
attempt has been made to correlate the bands<br />
with known compounds. However, the information<br />
provided may be useful in quality control assessment<br />
of various species of V<strong>alerian</strong>a.<br />
a) Under 254 nm UV, the Dutch sample shows an<br />
extra band at R f 0.37. The most intense band of V.<br />
sitchensis is at R f 0.53, and the bands at the higher<br />
R f are missing. V. wallichi is characterized by<br />
two dominating bands at R f 0.37 and 0.53, and the<br />
bands at the higher R f are also missing.<br />
b) Under visible light, the Dutch sample has an<br />
extra olive green band at R f 0.37 and an intense<br />
violet band at R f 0.25. The band at the same R f in<br />
V. sitchensis and V. wallichi is blue. The most<br />
intense band of V. sitchensis is a brown band at R f<br />
0.53. There are a blue and a brown band at R f 0.37.<br />
No bands appear at R f 0.55 and 0.8. V. wallichi is<br />
similar to V. sitchensis with the exception that the<br />
band at R f 0.37 is more intense and of brown color.<br />
In the Dutch sample, there is an extra reddishbrown<br />
band when viewed under 366 nm UV. V.<br />
sitchensis is characterized by two very strong<br />
white bands at R f 0.38 and 0.5. An additional red<br />
band is present at R f 0.18. V. wallichi shows a<br />
sharp violet band at R f 0.48 between two broad<br />
brown bands.<br />
c) The Dutch sample shows an extra olive green<br />
band at R f 0.37. V. sitchensis and V. wallichi show<br />
a pattern similar to that of V. officinalis; however,<br />
the intensity of the bands is significantly different<br />
in all three species.<br />
<strong>American</strong> <strong>Herbal</strong> <strong>Pharmacopoeia</strong> • V<strong>alerian</strong> R<strong>oot</strong> • April 1999 Page 11