Comparative anatomy and evolution of the odontocete forelimb
Comparative anatomy and evolution of the odontocete forelimb
Comparative anatomy and evolution of the odontocete forelimb

You also want an ePaper? Increase the reach of your titles
YUMPU automatically turns print PDFs into web optimized ePapers that Google loves.
4 MARINE MAMMAL SCIENCE, VOL. **, NO. **, 2009<br />
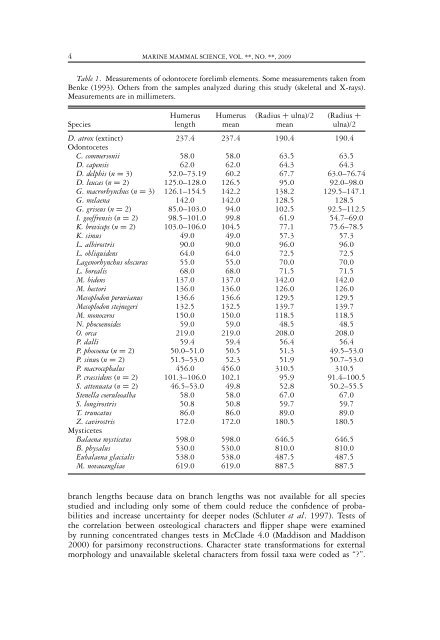
Table 1. Measurements <strong>of</strong> <strong>odontocete</strong> <strong>forelimb</strong> elements. Some measurements taken from<br />
Benke (1993). O<strong>the</strong>rs from <strong>the</strong> samples analyzed during this study (skeletal <strong>and</strong> X-rays).<br />
Measurements are in millimeters.<br />
Humerus Humerus (Radius + ulna)/2 (Radius +<br />
Species length mean mean ulna)/2<br />
D. atrox (extinct)<br />
Odontocetes<br />
237.4 237.4 190.4 190.4<br />
C. commersonii 58.0 58.0 63.5 63.5<br />
D. capensis 62.0 62.0 64.3 64.3<br />
D. delphis (n = 3) 52.0–73.19 60.2 67.763.0–76.74 D. leucas (n = 2) 125.0–128.0 126.5 95.092.0–98.0 G. macrorhynchus (n = 3) 126.1–154.5 142.2 138.2 129.5–147.1<br />
G. melaena 142.0 142.0 128.5 128.5<br />
G. griseus (n = 2) 85.0–103.0 94.0 102.5 92.5–112.5<br />
I. ge<strong>of</strong>frensis (n = 2) 98.5–101.0 99.8 61.954.7–69.0 K. breviceps (n = 2) 103.0–106.0 104.5 77.175.6–78.5 K. simus 49.0 49.0 57.3 57.3<br />
L. albirostris 90.0 90.0 96.0 96.0<br />
L. obliquidens 64.0 64.0 72.5 72.5<br />
Lagenorhynchus obscurus 55.0 55.0 70.0 70.0<br />
L. borealis 68.0 68.0 71.5 71.5<br />
M. bidens 137.0 137.0 142.0 142.0<br />
M. hectori 136.0 136.0 126.0 126.0<br />
Mesoplodon peruvianus 136.6 136.6 129.5 129.5<br />
Mesoplodon stejnegeri 132.5 132.5 139.7 139.7<br />
M. monoceros 150.0 150.0 118.5 118.5<br />
N. phocoenoides 59.0 59.0 48.5 48.5<br />
O. orca 219.0 219.0 208.0 208.0<br />
P. dalli 59.4 59.4 56.4 56.4<br />
P. phocoena (n = 2) 50.0–51.0 50.5 51.349.5–53.0 P. sinus(n = 2) 51.5–53.0 52.3 51.950.7–53.0 P. macrocephalus 456.0 456.0 310.5 310.5<br />
P. crassidens (n = 2) 101.3–106.0 102.1 95.991.4–100.5 S. attenuata (n = 2) 46.5–53.0 49.8 52.850.2–55.5 Stenella coeruleoalba 58.0 58.0 67.0 67.0<br />
S. longirostris 50.8 50.8 59.7 59.7<br />
T. truncatus 86.0 86.0 89.0 89.0<br />
Z. cavirostris<br />
Mysticetes<br />
172.0 172.0 180.5 180.5<br />
Balaena mysticetus 598.0 598.0 646.5 646.5<br />
B. physalus 530.0 530.0 810.0 810.0<br />
Eubalaena glacialis 538.0 538.0 487.5 487.5<br />
M. novaeangliae 619.0 619.0 887.5 887.5<br />
branch lengths because data on branch lengths was not available for all species<br />
studied <strong>and</strong> including only some <strong>of</strong> <strong>the</strong>m could reduce <strong>the</strong> confidence <strong>of</strong> probabilities<br />
<strong>and</strong> increase uncertainty for deeper nodes (Schluter et al. 1997). Tests <strong>of</strong><br />
<strong>the</strong> correlation between osteological characters <strong>and</strong> flipper shape were examined<br />
by running concentrated changes tests in McClade 4.0 (Maddison <strong>and</strong> Maddison<br />
2000) for parsimony reconstructions. Character state transformations for external<br />
morphology <strong>and</strong> unavailable skeletal characters from fossil taxa were coded as “?”.