PROPERTIES OF Eu3+ LUMINESCENCE IN ... - Ceramics-Silikaty
PROPERTIES OF Eu3+ LUMINESCENCE IN ... - Ceramics-Silikaty
PROPERTIES OF Eu3+ LUMINESCENCE IN ... - Ceramics-Silikaty

You also want an ePaper? Increase the reach of your titles
YUMPU automatically turns print PDFs into web optimized ePapers that Google loves.
Relative intensity (a.u.)<br />
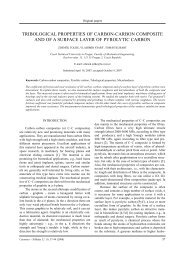
Figure 3. Emission intensity vs europium concentration (x) of<br />
Ba 2-xMgSi 2O 7: Eu x 3+ phosphor under various excitation wavelengths<br />
(λ em = 614 nm).<br />
The emission intensity (I) per activator ion follows<br />
the equation [22, 23]:<br />
where x is the activator concentration; Q = 6, 8, 10 for<br />
dipole-dipole(d-d), dipole-quadrupole(d-q), quadrupolequadrupole(q-q)<br />
interactions, respectively; and K and<br />
β are constant for the same excitation conditions for a<br />
given host crystal. The critical concentration of Eu 3+<br />
has been determined to be 0.05 mol. The dependence<br />
of the emission intensity of Ba 2MgSi 2O 7: Eu 3+ phosphor<br />
excited at 394 nm as a function of the corresponding<br />
concentration of Eu 3+ for concentration greater than<br />
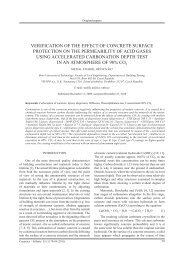
the critical concentration is determined. The polt of<br />
lg I/x Eu 3+ as a function of lg x Eu 3+ in Ba 2-xMgSi 2O 7: Eu x 3+<br />
phosphor are shown in Figure 4. It can be seen that<br />
dependence of lg x Eu 3+ on lg I/x Eu 3+ is linear and the slope<br />
is -1.989. The value of Q can be calculated as 5.967,<br />
which is close to 6. The result indicates that the con-<br />
centration self-quenching mechanism of Eu 3+ luminescence<br />
in Ba 2MgSi 2O 7 is the d-d interaction.<br />
3+<br />
lg I/x Eu<br />
λ ex = 394 nm<br />
λ ex = 465 nm<br />
λ ex = 381 nm<br />
λ ex = 362 nm<br />
λ ex = 413 nm<br />
0 0.02 0.04 0.06 0.08 0.1<br />
Eu concentration (x)<br />
6.0<br />
5.5<br />
5.0<br />
4.5<br />
4.0<br />
3.5<br />
-2.0 -1.8 -1.6<br />
3+ lg xEu -1.4 -1.2<br />
Figure 4. Plot of lg I/x 3+<br />
Eu as a function of 1 lg x 3+<br />
Eu in Ba2 3+<br />
xMgSi2O7: Eux phosphors (λex = 394 nm).<br />
Yao S., Xue L., Yan Y.<br />
-1.0<br />
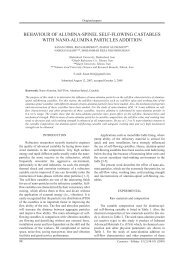
The excitation spectra of Ba 1.95MgSi 2O 7: Eu 0.05 3+<br />
is measured in the wavelength range of 260-465 nm by<br />
monitoring with the intense red emission located at 614<br />
nm (Figure 5a). The excitation spectra consist of two<br />
intense bands at 394 and 465 nm in addition to three<br />
relatively weak bands peaking about 362, 381, and 413<br />
nm. The bands peaking around 362, 394 and 465 nm are<br />
assigned to transition from the 7 F 0 level to the 5 D 4, 5 L 6,<br />
and 5 D 2 levels of f-f transitions of Eu 3+ , respectively. On<br />
the other hand, rest of the bands peaking around 381 and<br />
413 nm are assigned to the transitions from the thermal<br />
populated 7 F 1 level to the 5 F 4 and 5 L 3 [24, 25]. The strong<br />
broad band peaking at 394 nm and the narrow band at<br />
465 nm correspond to the characteristic f-f transitions<br />
of Eu 3+ within its 4 f 6 configuration. Figure 5b shows<br />
the emission spectral of as-synthesized Eu 3+ -doped<br />
Ba 2MgSi 2O 7 phosphors. The spectrum exhibits two main<br />
peaks centered at 591 and 614 nm, which come from the<br />
transitions of 5 D 0→ 7 F 1 and 5 D 0→ 7 F 2, respectively. The<br />
most intense emission is the 5 D 0→ 7 F 2 transition located<br />
at 614 nm, corresponding to the red emission, in good<br />
accordance with the Judd-Ofelt theory [24]. Therefore,<br />
strong red emission can be observed. The main excitation<br />
peaks indicate the phosphor is very suitable for a color<br />
converter using UV lights as the primary light source. It<br />
can be used as a red phosphor excited by UV-LED chip<br />
and would have applications in the solid-state lighting<br />
field.<br />
a) λ em = 614 nm b)<br />
300 400 500 600 700<br />
Wavelength (nm)<br />
λ ex = 394 nm<br />
3+<br />
Figure 5. Photoluminescence spectra of Ba1.95MgSi2O7: Eu0.05 phosphor.<br />
Color purity can be visualized in the chromaticity<br />
diagram (Figure 6) as blue, red, and green regions,<br />
using the color coordinates of the luminescent material<br />
emission. So, from the luminescence emission spectra<br />
of Ba 1.95MgSi 2O 7:Eu 0.05 3+ sample we obtained the<br />
chromaticity coordiantes with the aid of the Spectra Lux<br />
Software v.2.0 Beta [14]. For any given color there is<br />
one setting for each three number X, Y and Z known as<br />
254 <strong>Ceramics</strong> – Silikáty 55 (3) 251-255 (2011)<br />
Relative intensity (a.u.)<br />
λ ex = 465 nm<br />
λ ex = 381 nm<br />
λ ex = 362 nm<br />
λ ex = 413 nm<br />
800