EX-POST BEHAVIOR IN INSURANCE MARKETS* Greg Nini ...
EX-POST BEHAVIOR IN INSURANCE MARKETS* Greg Nini ...
EX-POST BEHAVIOR IN INSURANCE MARKETS* Greg Nini ...

You also want an ePaper? Increase the reach of your titles
YUMPU automatically turns print PDFs into web optimized ePapers that Google loves.
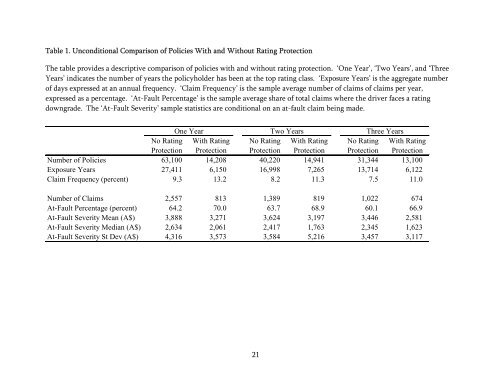
Table 1. Unconditional Comparison of Policies With and Without Rating Protection<br />
The table provides a descriptive comparison of policies with and without rating protection. ‘One Year’, ‘Two Years’, and ‘Three<br />
Years’ indicates the number of years the policyholder has been at the top rating class. ‘Exposure Years’ is the aggregate number<br />
of days expressed at an annual frequency. ‘Claim Frequency’ is the sample average number of claims of claims per year,<br />
expressed as a percentage. ‘At-Fault Percentage’ is the sample average share of total claims where the driver faces a rating<br />
downgrade. The ‘At-Fault Severity’ sample statistics are conditional on an at-fault claim being made.<br />
One Year Two Years Three Years<br />
No Rating With Rating No Rating With Rating No Rating With Rating<br />
Protection Protection Protection Protection Protection Protection<br />
Number of Policies 63,100 14,208 40,220 14,941 31,344 13,100<br />
Exposure Years 27,411 6,150 16,998 7,265 13,714 6,122<br />
Claim Frequency (percent) 9.3 13.2 8.2 11.3 7.5 11.0<br />
Number of Claims 2,557 813 1,389 819 1,022 674<br />
At-Fault Percentage (percent) 64.2 70.0 63.7 68.9 60.1 66.9<br />
At-Fault Severity Mean (A$) 3,888 3,271 3,624 3,197 3,446 2,581<br />
At-Fault Severity Median (A$) 2,634 2,061 2,417 1,763 2,345 1,623<br />
At-Fault Severity St Dev (A$) 4,316 3,573 3,584 5,216 3,457 3,117<br />
21