A NEW BROWN ALGAL ORDER, ISHIGEALES (PHAEOPHYCEAE ...
A NEW BROWN ALGAL ORDER, ISHIGEALES (PHAEOPHYCEAE ...
A NEW BROWN ALGAL ORDER, ISHIGEALES (PHAEOPHYCEAE ...

Create successful ePaper yourself
Turn your PDF publications into a flip-book with our unique Google optimized e-Paper software.
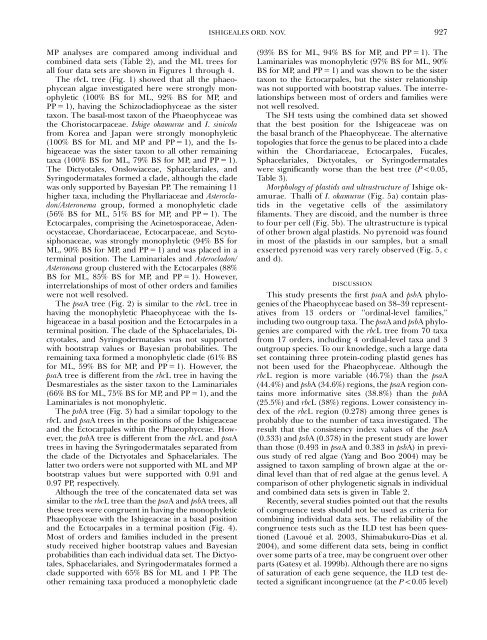
MP analyses are compared among individual and<br />
combined data sets (Table 2), and the ML trees for<br />
all four data sets are shown in Figures 1 through 4.<br />
The rbcL tree (Fig. 1) showed that all the phaeophycean<br />
algae investigated here were strongly monophyletic<br />
(100% BS for ML, 92% BS for MP, and<br />
PP 5 1), having the Schizocladiophyceae as the sister<br />
taxon. The basal-most taxon of the Phaeophyceae was<br />
the Choristocarpaceae. Ishige okamurae and I. sinicola<br />
from Korea and Japan were strongly monophyletic<br />
(100% BS for ML and MP and PP 5 1), and the Ishigeaceae<br />
was the sister taxon to all other remaining<br />
taxa (100% BS for ML, 79% BS for MP, and PP 5 1).<br />
The Dictyotales, Onslowiaceae, Sphacelariales, and<br />
Syringodermatales formed a clade, although the clade<br />
was only supported by Bayesian PP. The remaining 11<br />
higher taxa, including the Phyllariaceae and Asterocladon/Asteronema<br />
group, formed a monophyletic clade<br />
(56% BS for ML, 51% BS for MP, and PP 5 1). The<br />
Ectocarpales, comprising the Acinetosporaceae, Adenocystaceae,<br />
Chordariaceae, Ectocarpaceae, and Scytosiphonaceae,<br />
was strongly monophyletic (94% BS for<br />
ML, 90% BS for MP, and PP 5 1) and was placed in a<br />
terminal position. The Laminariales and Asterocladon/<br />
Asteronema group clustered with the Ectocarpales (88%<br />
BS for ML, 85% BS for MP, and PP 5 1). However,<br />
interrelationships of most of other orders and families<br />
were not well resolved.<br />
The psaA tree (Fig. 2) is similar to the rbcL tree in<br />
having the monophyletic Phaeophyceae with the Ishigeaceae<br />
in a basal position and the Ectocarpales in a<br />
terminal position. The clade of the Sphacelariales, Dictyotales,<br />
and Syringodermatales was not supported<br />
with bootstrap values or Bayesian probabilities. The<br />
remaining taxa formed a monophyletic clade (61% BS<br />
for ML, 59% BS for MP, and PP 5 1). However, the<br />
psaA tree is different from the rbcL tree in having the<br />
Desmarestiales as the sister taxon to the Laminariales<br />
(66% BS for ML, 75% BS for MP, and PP 5 1), and the<br />
Laminariales is not monophyletic.<br />
The psbA tree (Fig. 3) had a similar topology to the<br />
rbcL and psaA trees in the positions of the Ishigeaceae<br />
and the Ectocarpales within the Phaeophyceae. However,<br />
the psbA tree is different from the rbcL and psaA<br />
trees in having the Syringodermatales separated from<br />
the clade of the Dictyotales and Sphacelariales. The<br />
latter two orders were not supported with ML and MP<br />
bootstrap values but were supported with 0.91 and<br />
0.97 PP, respectively.<br />
Although the tree of the concatenated data set was<br />
similar to the rbcL tree than the psaA andpsbA trees, all<br />
these trees were congruent in having the monophyletic<br />
Phaeophyceae with the Ishigeaceae in a basal position<br />
and the Ectocarpales in a terminal position (Fig. 4).<br />
Most of orders and families included in the present<br />
study received higher bootstrap values and Bayesian<br />
probabilities than each individual data set. The Dictyotales,<br />
Sphacelariales, and Syringodermatales formed a<br />
clade supported with 65% BS for ML and 1 PP. The<br />
other remaining taxa produced a monophyletic clade<br />
<strong>ISHIGEALES</strong> ORD. NOV. 927<br />
(93% BS for ML, 94% BS for MP, and PP 5 1). The<br />
Laminariales was monophyletic (97% BS for ML, 90%<br />
BS for MP, and PP 5 1) and was shown to be the sister<br />
taxon to the Ectocarpales, but the sister relationship<br />
was not supported with bootstrap values. The interrelationships<br />
between most of orders and families were<br />
not well resolved.<br />
The SH tests using the combined data set showed<br />
that the best position for the Ishigeaceae was on<br />
the basal branch of the Phaeophyceae. The alternative<br />
topologies that force the genus to be placed into a clade<br />
within the Chordariaceae, Ectocarpales, Fucales,<br />
Sphacelariales, Dictyotales, or Syringodermatales<br />
were significantly worse than the best tree (Po0.05,<br />
Table 3).<br />
Morphology of plastids and ultrastructure of Ishige okamurae.<br />
Thalli of I. okamurae (Fig. 5a) contain plastids<br />
in the vegetative cells of the assimilatory<br />
filaments. They are discoid, and the number is three<br />
to four per cell (Fig. 5b). The ultrastructure is typical<br />
of other brown algal plastids. No pyrenoid was found<br />
in most of the plastids in our samples, but a small<br />
exserted pyrenoid was very rarely observed (Fig. 5, c<br />
and d).<br />
DISCUSSION<br />
This study presents the first psaA and psbA phylogenies<br />
of the Phaeophyceae based on 38–39 representatives<br />
from 13 orders or ‘‘ordinal-level families,’’<br />
including two outgroup taxa. The psaA and psbA phylogenies<br />
are compared with the rbcL tree from 70 taxa<br />
from 17 orders, including 4 ordinal-level taxa and 3<br />
outgroup species. To our knowledge, such a large data<br />
set containing three protein-coding plastid genes has<br />
not been used for the Phaeophyceae. Although the<br />
rbcL region is more variable (46.7%) than the psaA<br />
(44.4%) and psbA (34.6%) regions, the psaA region contains<br />
more informative sites (38.8%) than the psbA<br />
(25.5%) and rbcL (38%) regions. Lower consistency index<br />
of the rbcL region (0.278) among three genes is<br />
probably due to the number of taxa investigated. The<br />
result that the consistency index values of the psaA<br />
(0.333) and psbA (0.378) in the present study are lower<br />
than those (0.493 in psaA and 0.383 in psbA) in previous<br />
study of red algae (Yang and Boo 2004) may be<br />
assigned to taxon sampling of brown algae at the ordinal<br />
level than that of red algae at the genus level. A<br />
comparison of other phylogenetic signals in individual<br />
and combined data sets is given in Table 2.<br />
Recently, several studies pointed out that the results<br />
of congruence tests should not be used as criteria for<br />
combining individual data sets. The reliability of the<br />
congruence tests such as the ILD test has been questioned<br />
(Lavoué et al. 2003, Shimabukuro-Dias et al.<br />
2004), and some different data sets, being in conflict<br />
over some parts of a tree, may be congruent over other<br />
parts (Gatesy et al. 1999b). Although there are no signs<br />
of saturation of each gene sequence, the ILD test detected<br />
a significant incongruence (at the Po0.05 level)