Memorandum-to-the-Prime-Minister-on-Unaffordable-Housing
Memorandum-to-the-Prime-Minister-on-Unaffordable-Housing
Memorandum-to-the-Prime-Minister-on-Unaffordable-Housing
You also want an ePaper? Increase the reach of your titles
YUMPU automatically turns print PDFs into web optimized ePapers that Google loves.
Appendix 5 - Changes in <str<strong>on</strong>g>the</str<strong>on</strong>g><br />
affordability of owning<br />
(Peter Ambrose)<br />
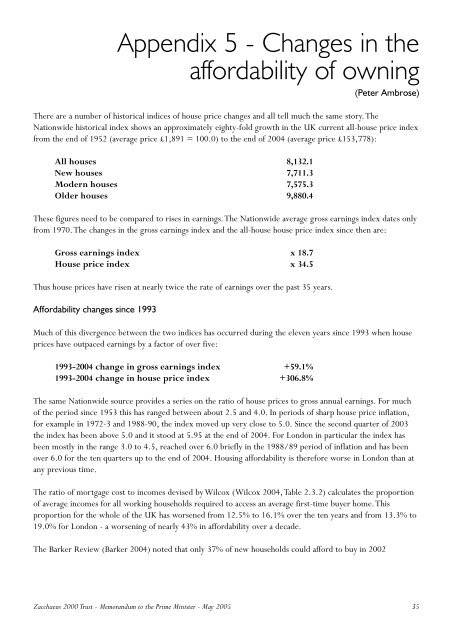
There are a number of his<str<strong>on</strong>g>to</str<strong>on</strong>g>rical indices of house price changes and all tell much <str<strong>on</strong>g>the</str<strong>on</strong>g> same s<str<strong>on</strong>g>to</str<strong>on</strong>g>ry.The<br />
Nati<strong>on</strong>wide his<str<strong>on</strong>g>to</str<strong>on</strong>g>rical index shows an approximately eighty-fold growth in <str<strong>on</strong>g>the</str<strong>on</strong>g> UK current all-house price index<br />
from <str<strong>on</strong>g>the</str<strong>on</strong>g> end of 1952 (average price £1,891 = 100.0) <str<strong>on</strong>g>to</str<strong>on</strong>g> <str<strong>on</strong>g>the</str<strong>on</strong>g> end of 2004 (average price £153,778):<br />
All houses 8,132.1<br />
New houses 7,711.3<br />
Modern houses 7,575.3<br />
Older houses 9,880.4<br />
These figures need <str<strong>on</strong>g>to</str<strong>on</strong>g> be compared <str<strong>on</strong>g>to</str<strong>on</strong>g> rises in earnings.The Nati<strong>on</strong>wide average gross earnings index dates <strong>on</strong>ly<br />
from 1970.The changes in <str<strong>on</strong>g>the</str<strong>on</strong>g> gross earnings index and <str<strong>on</strong>g>the</str<strong>on</strong>g> all-house house price index since <str<strong>on</strong>g>the</str<strong>on</strong>g>n are:<br />
Gross earnings index x 18.7<br />
House price index x 34.5<br />
Thus house prices have risen at nearly twice <str<strong>on</strong>g>the</str<strong>on</strong>g> rate of earnings over <str<strong>on</strong>g>the</str<strong>on</strong>g> past 35 years.<br />
Affordability changes since 1993<br />
Much of this divergence between <str<strong>on</strong>g>the</str<strong>on</strong>g> two indices has occurred during <str<strong>on</strong>g>the</str<strong>on</strong>g> eleven years since 1993 when house<br />
prices have outpaced earnings by a fac<str<strong>on</strong>g>to</str<strong>on</strong>g>r of over five:<br />
1993-2004 change in gross earnings index +59.1%<br />
1993-2004 change in house price index +306.8%<br />
The same Nati<strong>on</strong>wide source provides a series <strong>on</strong> <str<strong>on</strong>g>the</str<strong>on</strong>g> ratio of house prices <str<strong>on</strong>g>to</str<strong>on</strong>g> gross annual earnings. For much<br />
of <str<strong>on</strong>g>the</str<strong>on</strong>g> period since 1953 this has ranged between about 2.5 and 4.0. In periods of sharp house price inflati<strong>on</strong>,<br />
for example in 1972-3 and 1988-90, <str<strong>on</strong>g>the</str<strong>on</strong>g> index moved up very close <str<strong>on</strong>g>to</str<strong>on</strong>g> 5.0. Since <str<strong>on</strong>g>the</str<strong>on</strong>g> sec<strong>on</strong>d quarter of 2003<br />
<str<strong>on</strong>g>the</str<strong>on</strong>g> index has been above 5.0 and it s<str<strong>on</strong>g>to</str<strong>on</strong>g>od at 5.95 at <str<strong>on</strong>g>the</str<strong>on</strong>g> end of 2004. For L<strong>on</strong>d<strong>on</strong> in particular <str<strong>on</strong>g>the</str<strong>on</strong>g> index has<br />
been mostly in <str<strong>on</strong>g>the</str<strong>on</strong>g> range 3.0 <str<strong>on</strong>g>to</str<strong>on</strong>g> 4.5, reached over 6.0 briefly in <str<strong>on</strong>g>the</str<strong>on</strong>g> 1988/89 period of inflati<strong>on</strong> and has been<br />
over 6.0 for <str<strong>on</strong>g>the</str<strong>on</strong>g> ten quarters up <str<strong>on</strong>g>to</str<strong>on</strong>g> <str<strong>on</strong>g>the</str<strong>on</strong>g> end of 2004. <strong>Housing</strong> affordability is <str<strong>on</strong>g>the</str<strong>on</strong>g>refore worse in L<strong>on</strong>d<strong>on</strong> than at<br />
any previous time.<br />
The ratio of mortgage cost <str<strong>on</strong>g>to</str<strong>on</strong>g> incomes devised by Wilcox (Wilcox 2004,Table 2.3.2) calculates <str<strong>on</strong>g>the</str<strong>on</strong>g> proporti<strong>on</strong><br />
of average incomes for all working households required <str<strong>on</strong>g>to</str<strong>on</strong>g> access an average first-time buyer home.This<br />
proporti<strong>on</strong> for <str<strong>on</strong>g>the</str<strong>on</strong>g> whole of <str<strong>on</strong>g>the</str<strong>on</strong>g> UK has worsened from 12.5% <str<strong>on</strong>g>to</str<strong>on</strong>g> 16.1% over <str<strong>on</strong>g>the</str<strong>on</strong>g> ten years and from 13.3% <str<strong>on</strong>g>to</str<strong>on</strong>g><br />
19.0% for L<strong>on</strong>d<strong>on</strong> - a worsening of nearly 43% in affordability over a decade.<br />
The Barker Review (Barker 2004) noted that <strong>on</strong>ly 37% of new households could afford <str<strong>on</strong>g>to</str<strong>on</strong>g> buy in 2002<br />
Zacchaeus 2000 Trust - <str<strong>on</strong>g>Memorandum</str<strong>on</strong>g> <str<strong>on</strong>g>to</str<strong>on</strong>g> <str<strong>on</strong>g>the</str<strong>on</strong>g> <str<strong>on</strong>g>Prime</str<strong>on</strong>g> <str<strong>on</strong>g>Minister</str<strong>on</strong>g> - May 2005 35


