

The U.S. Digital Video Benchmark
The U.S. Digital Video Benchmark
The U.S. Digital Video Benchmark

Create successful ePaper yourself
Turn your PDF publications into a flip-book with our unique Google optimized e-Paper software.
ADOBE DIGITAL INDEX<br />
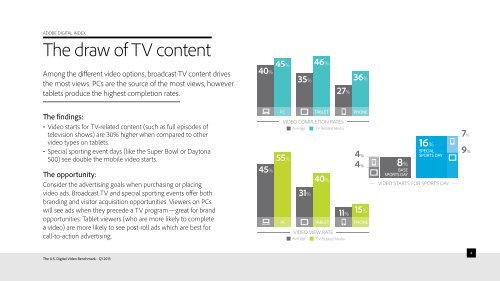
<strong>The</strong> draw of TV content<br />
Among the different video options, broadcast TV content drives<br />
the most views. PCs are the source of the most views, however<br />
tablets produce the highest completion rates.<br />
<strong>The</strong> findings:<br />
• <strong>Video</strong> starts for TV-related content (such as full episodes of<br />
television shows) are 30% higher when compared to other<br />
video types on tablets.<br />
• Special sporting event days (like the Super Bowl or Daytona<br />
500) see double the mobile video starts.<br />
<strong>The</strong> opportunity:<br />
Consider the advertising goals when purchasing or placing<br />
video ads. Broadcast TV and special sporting events offer both<br />
branding and visitor acquisition opportunities. Viewers on PCs<br />
will see ads when they precede a TV program—great for brand<br />
opportunities. Tablet viewers (who are more likely to complete<br />
a video) are more likely to see post-roll ads which are best for<br />
call-to-action advertising.<br />
<strong>The</strong> U.S. <strong>Digital</strong> <strong>Video</strong> <strong>Benchmark</strong> - Q1 2013<br />
VIDEO COMPLETION RATES<br />
VIDEO VIEW RATE<br />
VIDEO STARTS FOR SPORTS DAY<br />
4