Colin Pittendrigh, Jürgen Aschoff, and the Natural Entrainment - CBN
Colin Pittendrigh, Jürgen Aschoff, and the Natural Entrainment - CBN
Colin Pittendrigh, Jürgen Aschoff, and the Natural Entrainment - CBN
You also want an ePaper? Increase the reach of your titles
YUMPU automatically turns print PDFs into web optimized ePapers that Google loves.
202 JOURNAL OF BIOLOGICAL RHYTHMS / June 2000<br />
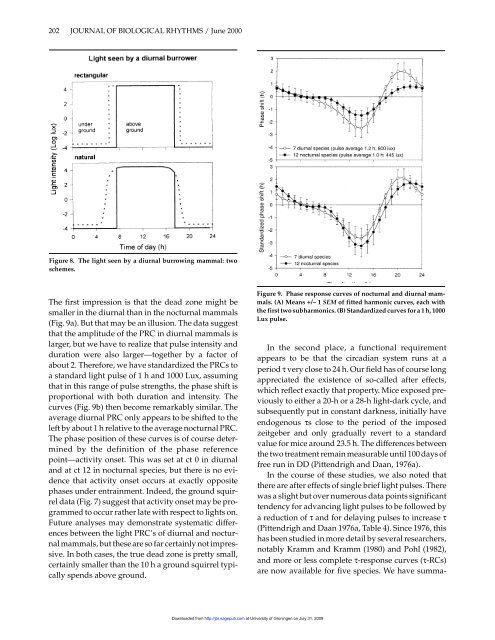
Figure 8. The light seen by a diurnal burrowing mammal: two<br />
schemes.<br />
The first impression is that <strong>the</strong> dead zone might be<br />
smaller in <strong>the</strong> diurnal than in <strong>the</strong> nocturnal mammals<br />
(Fig. 9a). But that may be an illusion. The data suggest<br />
that <strong>the</strong> amplitude of <strong>the</strong> PRC in diurnal mammals is<br />
larger, but we have to realize that pulse intensity <strong>and</strong><br />
duration were also larger—toge<strong>the</strong>r by a factor of<br />
about 2. Therefore, we have st<strong>and</strong>ardized <strong>the</strong> PRCs to<br />
a st<strong>and</strong>ard light pulse of 1 h <strong>and</strong> 1000 Lux, assuming<br />
that in this range of pulse strengths, <strong>the</strong> phase shift is<br />
proportional with both duration <strong>and</strong> intensity. The<br />
curves (Fig. 9b) <strong>the</strong>n become remarkably similar. The<br />
average diurnal PRC only appears to be shifted to <strong>the</strong><br />
left by about 1 h relative to <strong>the</strong> average nocturnal PRC.<br />
The phase position of <strong>the</strong>se curves is of course determined<br />
by <strong>the</strong> definition of <strong>the</strong> phase reference<br />
point—activity onset. This was set at ct 0 in diurnal<br />
<strong>and</strong> at ct 12 in nocturnal species, but <strong>the</strong>re is no evidence<br />
that activity onset occurs at exactly opposite<br />
phases under entrainment. Indeed, <strong>the</strong> ground squirrel<br />
data (Fig. 7) suggest that activity onset may be programmed<br />
to occur ra<strong>the</strong>r late with respect to lights on.<br />
Future analyses may demonstrate systematic differences<br />
between <strong>the</strong> light PRC’s of diurnal <strong>and</strong> nocturnal<br />
mammals, but <strong>the</strong>se are so far certainly not impressive.<br />
In both cases, <strong>the</strong> true dead zone is pretty small,<br />
certainly smaller than <strong>the</strong> 10 h a ground squirrel typically<br />
spends above ground.<br />
Downloaded from<br />
http://jbr.sagepub.com at University of Groningen on July 31, 2009<br />
Figure 9. Phase response curves of nocturnal <strong>and</strong> diurnal mammals.<br />
(A) Means +/– 1 SEM of fitted harmonic curves, each with<br />
<strong>the</strong> first two subharmonics. (B) St<strong>and</strong>ardized curves for a 1 h, 1000<br />
Lux pulse.<br />
In <strong>the</strong> second place, a functional requirement<br />
appears to be that <strong>the</strong> circadian system runs at a<br />
period τ very close to 24 h. Our field has of course long<br />
appreciated <strong>the</strong> existence of so-called after effects,<br />
which reflect exactly that property. Mice exposed previously<br />
to ei<strong>the</strong>r a 20-h or a 28-h light-dark cycle, <strong>and</strong><br />
subsequently put in constant darkness, initially have<br />
endogenous τs close to <strong>the</strong> period of <strong>the</strong> imposed<br />
zeitgeber <strong>and</strong> only gradually revert to a st<strong>and</strong>ard<br />
value for mice around 23.5 h. The differences between<br />
<strong>the</strong> two treatment remain measurable until 100 days of<br />
free run in DD (<strong>Pittendrigh</strong> <strong>and</strong> Daan, 1976a).<br />
In <strong>the</strong> course of <strong>the</strong>se studies, we also noted that<br />
<strong>the</strong>re are after effects of single brief light pulses. There<br />
was a slight but over numerous data points significant<br />
tendency for advancing light pulses to be followed by<br />
a reduction of τ <strong>and</strong> for delaying pulses to increase τ<br />
(<strong>Pittendrigh</strong> <strong>and</strong> Daan 1976a, Table 4). Since 1976, this<br />
has been studied in more detail by several researchers,<br />
notably Kramm <strong>and</strong> Kramm (1980) <strong>and</strong> Pohl (1982),<br />
<strong>and</strong> more or less complete τ-response curves (τ-RCs)<br />
are now available for five species. We have summa-


