Social determinantS of health Sectoral briefing SerieS 3
Social determinantS of health Sectoral briefing SerieS 3
Social determinantS of health Sectoral briefing SerieS 3

You also want an ePaper? Increase the reach of your titles
YUMPU automatically turns print PDFs into web optimized ePapers that Google loves.
In low- and middle-income countries, where motorization is a relatively<br />
recent phenomenon, motorized transport is rapidly replacing traditional nonmotorized<br />
transport modes such as walking and cycling. In spite <strong>of</strong> this,<br />
low- and middle-income countries’ investments in road infrastructure have<br />
generally not kept up with the pace <strong>of</strong> motorization and do not usually take<br />
into account the needs <strong>of</strong> non-motorized transport users (e.g. pedestrians,<br />
cyclists). This trend is associated with high rates <strong>of</strong> road fatalities that are<br />
particularly harsh for low-income and vulnerable populations (WHO 2004;<br />
2011a). Children are particularly affected. Indeed, globally road injuries are<br />
the second largest cause <strong>of</strong> mortality for the 5–14 age group, with 70 per<br />
cent <strong>of</strong> fatalities in low-income countries (WHO, 2009). It is estimated that the<br />
cost <strong>of</strong> traffi c accidents amounts to US$ 518 billion, and represents between<br />
1 per cent and 1.5 per cent <strong>of</strong> GDP in low- and middle-income countries, and<br />
2 per cent <strong>of</strong> GDP in high-income countries (Jacobs et al., 2000; UNEP, 2011).<br />
Overall, urban areas around the world are experiencing increasing<br />
congestion. This is causing higher transport costs and longer travel times,<br />
which <strong>of</strong>ten affect low-income groups the most. Congestion robs the<br />
European Union (EU) <strong>of</strong> 1 per cent <strong>of</strong> its entire gross domestic product<br />
(GDP). Across Europe, it is estimated that 2500 lives could be saved<br />
each year if emergency vehicles were not delayed on congested roads<br />
(TBC & IBM, 2009). In the United States, the cost <strong>of</strong> the time wasted<br />
on congested roads and extra fuel consumption is estimated at 0.7 per<br />
cent <strong>of</strong> GDP or around US$ 675 billion (FHWA, 2000). In Lima, Peru, it is<br />
estimated that on average a person spends four hours a day on congested<br />
roads resulting in lost productivity <strong>of</strong> around US$ 6.2 billion a year –<br />
equivalent to 10 per cent <strong>of</strong> the country’s GDP (UNESCAP, UN-ECLAC &<br />
Urban Design Lab, 2010).<br />
The expansion <strong>of</strong> road infrastructure to cope with the increased use <strong>of</strong><br />
motorized vehicles is also affecting land availability and usage. Frequently,<br />
large tracts <strong>of</strong> land are divided into smaller plots limiting movement across<br />
formerly contiguous areas, affecting community life, social cohesion,<br />
ecosystems and <strong>health</strong>. Moreover, road infrastructure expansion impacts<br />
on land use affecting agricultural productivity and farming activities (Hunter,<br />
transport (road transport): shared interests in sustainable outcomes<br />
<strong>Social</strong> determinants <strong>of</strong> <strong>health</strong> <strong>Sectoral</strong> briefi ng Series 3<br />
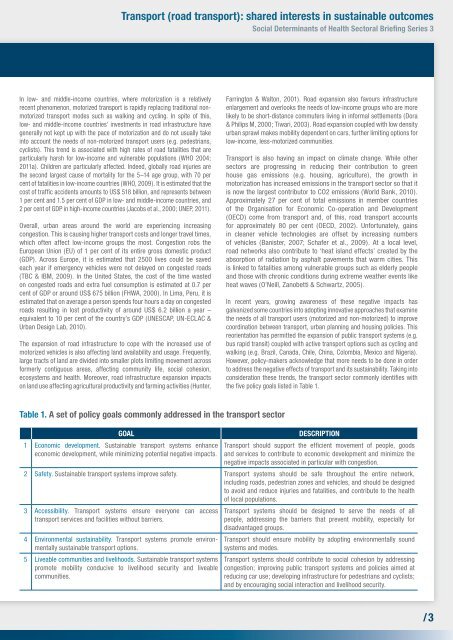
table 1. a set <strong>of</strong> policy goals commonly addressed in the transport sector<br />
Farrington & Walton, 2001). Road expansion also favours infrastructure<br />
enlargement and overlooks the needs <strong>of</strong> low-income groups who are more<br />
likely to be short-distance commuters living in informal settlements (Dora<br />
& Philips M, 2000; Tiwari, 2003). Road expansion coupled with low density<br />
urban sprawl makes mobility dependent on cars, further limiting options for<br />
low-income, less-motorized communities.<br />
Transport is also having an impact on climate change. While other<br />
sectors are progressing in reducing their contribution to green<br />
house gas emissions (e.g. housing, agriculture), the growth in<br />
motorization has increased emissions in the transport sector so that it<br />
is now the largest contributor to CO2 emissions (World Bank, 2010).<br />
Approximately 27 per cent <strong>of</strong> total emissions in member countries<br />
<strong>of</strong> the Organisation for Economic Co-operation and Development<br />
(OECD) come from transport and, <strong>of</strong> this, road transport accounts<br />
for approximately 80 per cent (OECD, 2002). Unfortunately, gains<br />
in cleaner vehicle technologies are <strong>of</strong>fset by increasing numbers<br />
<strong>of</strong> vehicles (Banister, 2007; Schafer et al., 2009). At a local level,<br />
road networks also contribute to ‘heat island effects’ created by the<br />
absorption <strong>of</strong> radiation by asphalt pavements that warm cities. This<br />
is linked to fatalities among vulnerable groups such as elderly people<br />
and those with chronic conditions during extreme weather events like<br />
heat waves (O’Neill, Zanobetti & Schwartz, 2005).<br />
In recent years, growing awareness <strong>of</strong> these negative impacts has<br />
galvanized some countries into adopting innovative approaches that examine<br />
the needs <strong>of</strong> all transport users (motorized and non-motorized) to improve<br />
coordination between transport, urban planning and housing policies. This<br />
reorientation has permitted the expansion <strong>of</strong> public transport systems (e.g.<br />
bus rapid transit) coupled with active transport options such as cycling and<br />
walking (e.g. Brazil, Canada, Chile, China, Colombia, Mexico and Nigeria).<br />
However, policy-makers acknowledge that more needs to be done in order<br />
to address the negative effects <strong>of</strong> transport and its sustainability. Taking into<br />
consideration these trends, the transport sector commonly identifi es with<br />
the fi ve policy goals listed in Table 1.<br />
goal deScription<br />
1 Economic development. Sustainable transport systems enhance<br />
economic development, while minimizing potential negative impacts.<br />
Transport should support the effi cient movement <strong>of</strong> people, goods<br />
and services to contribute to economic development and minimize the<br />
negative impacts associated in particular with congestion.<br />
2 Safety. Sustainable transport systems improve safety. Transport systems should be safe throughout the entire network,<br />
including roads, pedestrian zones and vehicles, and should be designed<br />
to avoid and reduce injuries and fatalities, and contribute to the <strong>health</strong><br />
<strong>of</strong> local populations.<br />
3 Accessibility. Transport systems ensure everyone can access<br />
transport services and facilities without barriers.<br />
4 Environmental sustainability. Transport systems promote environmentally<br />
sustainable transport options.<br />
5 Liveable communities and livelihoods. Sustainable transport systems<br />
promote mobility conducive to livelihood security and liveable<br />
communities.<br />
Transport systems should be designed to serve the needs <strong>of</strong> all<br />
people, addressing the barriers that prevent mobility, especially for<br />
disadvantaged groups.<br />
Transport should ensure mobility by adopting environmentally sound<br />
systems and modes.<br />
Transport systems should contribute to social cohesion by addressing<br />
congestion; improving public transport systems and policies aimed at<br />
reducing car use; developing infrastructure for pedestrians and cyclists;<br />
and by encouraging social interaction and livelihood security.<br />
/3