

Hospital Readmissions in Europe
Hospital Readmissions in Europe
Hospital Readmissions in Europe

You also want an ePaper? Increase the reach of your titles
YUMPU automatically turns print PDFs into web optimized ePapers that Google loves.
The Burrill Report<br />
with home monitor<strong>in</strong>g technology contributed to reduc<strong>in</strong>g stays at one Danish hospital to 2.9 days, versus the<br />
<strong>Europe</strong>an Union average of approximately 7 days, and lowered re-admission rates are <strong>in</strong> some cases down by more<br />
than 50 percent.<br />
Though data is not as available <strong>in</strong> other countries, there is evidence that the same rise <strong>in</strong> hospital readmissions <strong>in</strong> the<br />
United K<strong>in</strong>gdom has been seen elsewhere as people are pushed out of hospitals to cut costs. The average length<br />
of stay <strong>in</strong> hospitals has decreased over the past decade <strong>in</strong> all <strong>Europe</strong>an countries, fall<strong>in</strong>g from 8.2 days <strong>in</strong> 2000 to<br />
6.9 days <strong>in</strong> 2010 on average <strong>in</strong> E.U. member states.<br />
The average length of a hospital stay is, to some degree, regarded as an <strong>in</strong>dicator of efficiency, notes the <strong>Europe</strong>an<br />
Commission s<strong>in</strong>ce a shorter stay may reduce the cost per discharge, and shift care from <strong>in</strong>patient to less expensive<br />
Emergency <strong>Readmissions</strong>: England 2000-01 to 2010-11<br />
post-acute sett<strong>in</strong>gs. However, shorter stays tend to be more service <strong>in</strong>tensive and more costly per day. Too short a<br />
Number readmissions<br />
length of stay could also have adverse effects on health outcomes, or reduce the comfort and recovery of the patient.<br />
700,000 If this leads to a ris<strong>in</strong>g readmission rate, costs per episode of illness may fall little, or even rise.<br />
600,000<br />
The reduction <strong>in</strong> average Age 75+ length of stay was particularly marked <strong>in</strong> Bulgaria, Croatia, the Former Yugoslav Republic of<br />
Age 16+<br />
Macedonia 500,000 and Switzerland. It also decreased <strong>in</strong> the Netherlands and the United K<strong>in</strong>gdom. Several factors expla<strong>in</strong><br />
All ages<br />
this general decl<strong>in</strong>e, <strong>in</strong>clud<strong>in</strong>g the use of less <strong>in</strong>vasive surgical procedures, changes <strong>in</strong> hospital payment methods,<br />
400,000<br />
and the expansion of early discharge programs enabl<strong>in</strong>g patients to return to their home to receive follow-up care.<br />
300,000<br />
Age 0-15<br />
Age 16-74<br />
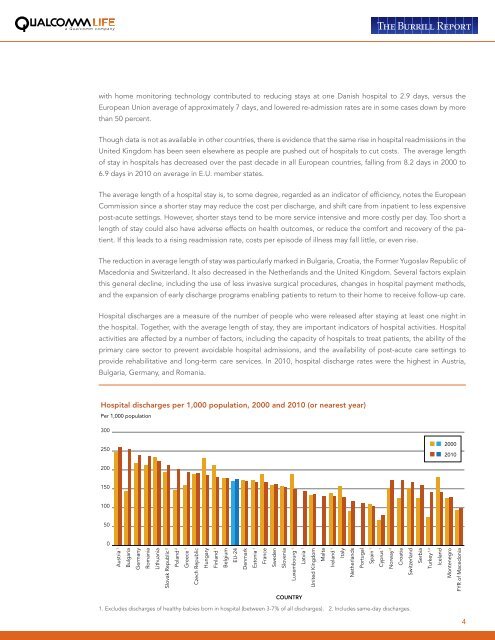
<strong>Hospital</strong> discharges are a measure of the number of people who were released after stay<strong>in</strong>g at least one night <strong>in</strong><br />
the 200,000 hospital. Together, with the average length of stay, they are important <strong>in</strong>dicators of hospital activities. <strong>Hospital</strong><br />
activities are affected by a number of factors, <strong>in</strong>clud<strong>in</strong>g the capacity of hospitals to treat patients, the ability of the<br />
100,000<br />
primary care sector to prevent avoidable hospital admissions, and the availability of post-acute care sett<strong>in</strong>gs to<br />
0<br />
provide rehabilitative and long-term care services. In 2010, hospital discharge rates were the highest <strong>in</strong> Austria,<br />
2000-01 2001-02 2002-03 2003-04 2004-05 2005-06 2006-07 2007-08 2008-09 2009-10 2010-11<br />
Bulgaria, Germany, and Romania.<br />
300<br />
250<br />
200<br />
150<br />
100<br />
50<br />
0<br />
Austria 1<br />
Bulgaria<br />
Germany<br />
Romania<br />
Lithuania<br />
Slovak Republic 2<br />
Poland 2<br />
Greece 1<br />
Czech Republic<br />
Hungary<br />
F<strong>in</strong>land 1<br />
Belgium<br />
EU-24<br />
Denmark<br />
Estonia 1<br />
COUNTRY<br />
1. Excludes discharges of healthy babies born <strong>in</strong> hospital (between 3-7% of all discharges). 2. Includes same-day discharges.<br />
France<br />
Sweden<br />
YEAR<br />
<strong>Hospital</strong> discharges per 1,000 population, 2000 and 2010 (or nearest year)<br />
Per 1,000 population<br />
Slovenia<br />
Luxembourg 1<br />
Latvia 1<br />
United K<strong>in</strong>gdom<br />
Malta<br />
Ireland 1<br />
Italy<br />
Netherlands<br />
Portugal<br />
Spa<strong>in</strong> 1<br />
Cyprus 1<br />
Norway 2<br />
Croatia<br />
Switzerland<br />
Serbia<br />
Turkey 1,2<br />
Iceland<br />
2000<br />
2010<br />
Montenegro<br />
FYR of Macedonia<br />
4