numerical simulation of buildings thermal behaviour and ... - ibpsa
numerical simulation of buildings thermal behaviour and ... - ibpsa
numerical simulation of buildings thermal behaviour and ... - ibpsa

You also want an ePaper? Increase the reach of your titles
YUMPU automatically turns print PDFs into web optimized ePapers that Google loves.
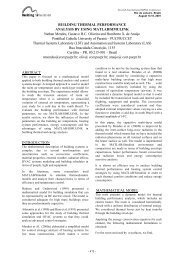
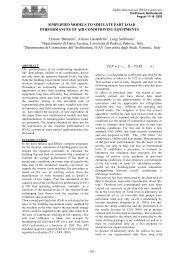
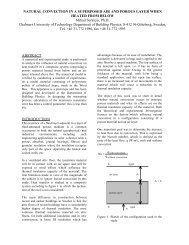
The air temperature (see figure 6) <strong>and</strong> relative<br />
humidity (see figure 7), in the external environment,<br />
was obtained experimentally in a Winter typical day.<br />
During the experimental test the sky remained clean<br />
<strong>and</strong> there was no wind.<br />
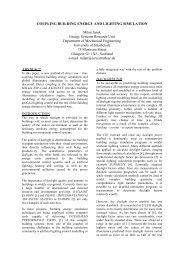
In figure 8 are presented the evolutions <strong>of</strong> air mean<br />
temperatures inside the compartments 1 (in the first<br />
floor, with a window turned towards South), 3 (in the<br />
first floor, with a window turned towards North), 7<br />
(in the first floor, with a window turned towards<br />
East), 8 (in the second floor, with a window turned<br />
towards West) <strong>and</strong> 9 (in the second floor, with a<br />
window turned towards South). In this <strong>simulation</strong>,<br />
done in 5 th February, it was also considered the five<br />
previous days, to evaluate the heat stored in building<br />
materials. The evolution <strong>of</strong> the glasses temperature in<br />
the windows 1, 2, 4, 6 <strong>and</strong> 7 is presented in figure 9.<br />
T (ºC)<br />
18<br />
17<br />
16<br />
15<br />
14<br />
13<br />
12<br />
11<br />
10<br />
0 2 4 6 8 10 12 14 16 18 20 22 24<br />
t (hours)<br />
Figure 6 – Air temperature in the external<br />
environment obtained experimentally in a winter<br />
typical day with clean sky.<br />
RH (%)<br />
80<br />
70<br />
60<br />
50<br />
40<br />
30<br />
0 2 4 6 8 10 12 14 16 18 20 22 24<br />
t (hours)<br />
Figure 7 – Air relative humidity in the external<br />
environment obtained experimentally in a winter<br />
typical day with clean sky.<br />
- 231 -<br />
T (ºC)<br />
T (ºC)<br />
28<br />
26<br />
24<br />
22<br />
20<br />
18<br />
9<br />
16<br />
0 2 4 6 8 10 12 14 16 18 20 22 24<br />
1<br />
3<br />
t (hours)<br />
Figure 8 - Evolution <strong>of</strong> the air mean temperature<br />
inside the compartments 1, 3, 7, 8 <strong>and</strong> 9.<br />
25<br />
23<br />
21<br />
19<br />
17<br />
15<br />
4<br />
13<br />
0 2 4 6 8 10 12 14 16 18 20 22 24<br />
6<br />
7<br />
t (hours)<br />
Figure 9 - Evolution <strong>of</strong> the glasses temperature in the<br />
windows 1, 2, 4, 6 <strong>and</strong> 7.<br />
The results obtained in the first part <strong>of</strong> this study,<br />
related to the building <strong>thermal</strong> <strong>behaviour</strong>, show that:<br />
- in general, the air temperature values are the<br />
lowest in compartments with windows turned<br />
towards North <strong>and</strong> the highest in compartments<br />
with windows turned towards South;<br />
- the air temperature values in compartments<br />
located in the second floor, in general, are higher<br />
than in compartments located in the first floor;<br />
- the glasses temperature, in general, are the<br />
highest for windows turned towards South.<br />
Nevertheless, when they are shaded by building<br />
bodies this is not verified (see the glass<br />
temperature evolution for the window 2 after<br />
13.30 p.m.).<br />
Human Thermal Comfort<br />
After being validated, with experimental data<br />
obtained in laboratory <strong>and</strong> presented in specialised<br />
bibliography (see, for example, Conceição <strong>and</strong> Lúcio<br />
(2001)), the model is used to evaluate the <strong>thermal</strong><br />
comfort level that an occupant is subjected in the<br />
compartment 8, when is seated in the desk near (see<br />
2<br />
1<br />
8<br />
7