

A GUIDE TO MAPPING AND MOBILIZING THE ASSOCIATIONS IN LOCAL NEIGHBORHOODS
A GUIDE TO MAPPING AND MOBILIZING THE ASSOCIATIONS IN LOCAL NEIGHBORHOODS
A GUIDE TO MAPPING AND MOBILIZING THE ASSOCIATIONS IN LOCAL NEIGHBORHOODS

You also want an ePaper? Increase the reach of your titles
YUMPU automatically turns print PDFs into web optimized ePapers that Google loves.
30<br />
An Example of an Association Mapping Project<br />
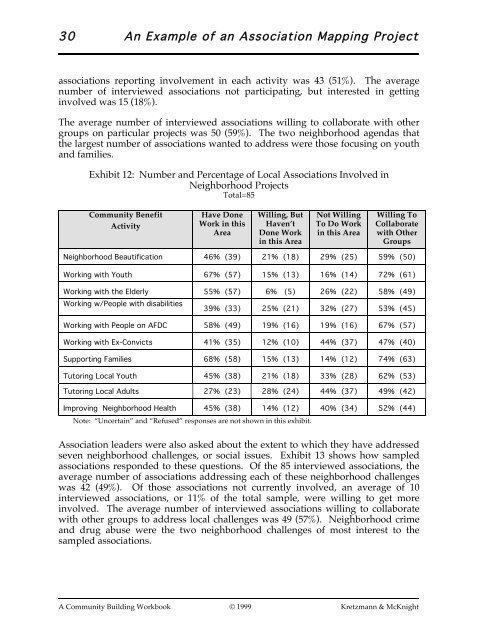
associations reporting involvement in each activity was 43 (51%). The average<br />
number of interviewed associations not participating, but interested in getting<br />
involved was 15 (18%).<br />
The average number of interviewed associations willing to collaborate with other<br />
groups on particular projects was 50 (59%). The two neighborhood agendas that<br />
the largest number of associations wanted to address were those focusing on youth<br />
and families.<br />
Exhibit 12: Number and Percentage of Local Associations Involved in<br />
Neighborhood Projects<br />
Total=85<br />
Community Benefit<br />
Activity<br />
Have Done<br />
Work in this<br />
Area<br />
Willing, But<br />
Haven’t<br />
Done Work<br />
in this Area<br />
Not Willing<br />
To Do Work<br />
in this Area<br />
Willing To<br />
Collaborate<br />
with Other<br />
Groups<br />
Neighborhood Beautification 46% (39) 21% (18) 29% (25) 59% (50)<br />
Working with Youth<br />
Working with the Elderly<br />
Working w/People with disabilities<br />
Working with People on AFDC<br />
Working with Ex-Convicts<br />
Supporting Families<br />
Tutoring Local Youth<br />
67% (57)<br />
55% (57)<br />
39% (33)<br />
58% (49)<br />
41% (35)<br />
68% (58)<br />
45% (38)<br />
15% (13)<br />
6% (5)<br />
25% (21)<br />
19% (16)<br />
12% (10)<br />
15% (13)<br />
21% (18)<br />
16% (14)<br />
26% (22)<br />
32% (27)<br />
19% (16)<br />
44% (37)<br />
14% (12)<br />
33% (28)<br />
72% (61)<br />
58% (49)<br />
53% (45)<br />
67% (57)<br />
47% (40)<br />
74% (63)<br />
62% (53)<br />
Tutoring Local Adults 27% (23) 28% (24) 44% (37) 49% (42)<br />
Improving Neighborhood Health<br />
45% (38)<br />
14% (12)<br />
Note: “Uncertain” and “Refused” responses are not shown in this exhibit.<br />
40% (34)<br />
52% (44)<br />
Association leaders were also asked about the extent to which they have addressed<br />
seven neighborhood challenges, or social issues. Exhibit 13 shows how sampled<br />
associations responded to these questions. Of the 85 interviewed associations, the<br />
average number of associations addressing each of these neighborhood challenges<br />
was 42 (49%). Of those associations not currently involved, an average of 10<br />
interviewed associations, or 11% of the total sample, were willing to get more<br />
involved. The average number of interviewed associations willing to collaborate<br />
with other groups to address local challenges was 49 (57%). Neighborhood crime<br />
and drug abuse were the two neighborhood challenges of most interest to the<br />
sampled associations.<br />
A Community Building Workbook © 1999 Kretzmann & McKnight