Ultraviolet Resonant Raman Enhancements in the Detection of ...
Ultraviolet Resonant Raman Enhancements in the Detection of ...
Ultraviolet Resonant Raman Enhancements in the Detection of ...
Create successful ePaper yourself
Turn your PDF publications into a flip-book with our unique Google optimized e-Paper software.
as <strong>the</strong> <strong>in</strong>ternal standard. For solids, <strong>the</strong> <strong>in</strong>troduction <strong>of</strong> an <strong>in</strong>ternal standard is more<br />
difficult s<strong>in</strong>ce heterogeneities <strong>in</strong> terms <strong>of</strong> particle sizes and distribution are present. This<br />
results <strong>in</strong> irreproducible measurements and large error especially when one considers that<br />
<strong>the</strong> typical laser beam spot size is on <strong>the</strong> order <strong>of</strong> tens <strong>of</strong> microns <strong>in</strong> diameter.<br />
The effects <strong>of</strong> laser attenuation and self-absorption <strong>of</strong> <strong>the</strong> <strong>Raman</strong> signal were<br />
derived <strong>in</strong> <strong>the</strong> Methods section. The laser penetration depth and return <strong>Raman</strong> signal are<br />
functions <strong>of</strong> <strong>the</strong> optical (absorption and scatter<strong>in</strong>g coefficients) and physical (particle size<br />
and sample thickness) properties <strong>of</strong> <strong>the</strong> sample. The wavelength dependent laser<br />
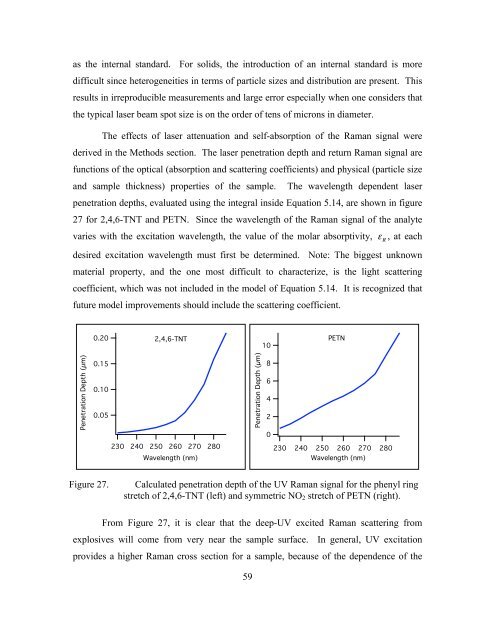
penetration depths, evaluated us<strong>in</strong>g <strong>the</strong> <strong>in</strong>tegral <strong>in</strong>side Equation 5.14, are shown <strong>in</strong> figure<br />
27 for 2,4,6-TNT and PETN. S<strong>in</strong>ce <strong>the</strong> wavelength <strong>of</strong> <strong>the</strong> <strong>Raman</strong> signal <strong>of</strong> <strong>the</strong> analyte<br />
varies with <strong>the</strong> excitation wavelength, <strong>the</strong> value <strong>of</strong> <strong>the</strong> molar absorptivity, , at each<br />
desired excitation wavelength must first be determ<strong>in</strong>ed. Note: The biggest unknown<br />
material property, and <strong>the</strong> one most difficult to characterize, is <strong>the</strong> light scatter<strong>in</strong>g<br />
coefficient, which was not <strong>in</strong>cluded <strong>in</strong> <strong>the</strong> model <strong>of</strong> Equation 5.14. It is recognized that<br />
future model improvements should <strong>in</strong>clude <strong>the</strong> scatter<strong>in</strong>g coefficient.<br />
Figure 27. Calculated penetration depth <strong>of</strong> <strong>the</strong> UV <strong>Raman</strong> signal for <strong>the</strong> phenyl r<strong>in</strong>g<br />
stretch <strong>of</strong> 2,4,6-TNT (left) and symmetric NO2 stretch <strong>of</strong> PETN (right).<br />
From Figure 27, it is clear that <strong>the</strong> deep-UV excited <strong>Raman</strong> scatter<strong>in</strong>g from<br />
explosives will come from very near <strong>the</strong> sample surface. In general, UV excitation<br />
provides a higher <strong>Raman</strong> cross section for a sample, because <strong>of</strong> <strong>the</strong> dependence <strong>of</strong> <strong>the</strong><br />
59


