Buffalo Sabres 2012-13 Media Guide - NHL.com
Buffalo Sabres 2012-13 Media Guide - NHL.com
Buffalo Sabres 2012-13 Media Guide - NHL.com

You also want an ePaper? Increase the reach of your titles
YUMPU automatically turns print PDFs into web optimized ePapers that Google loves.
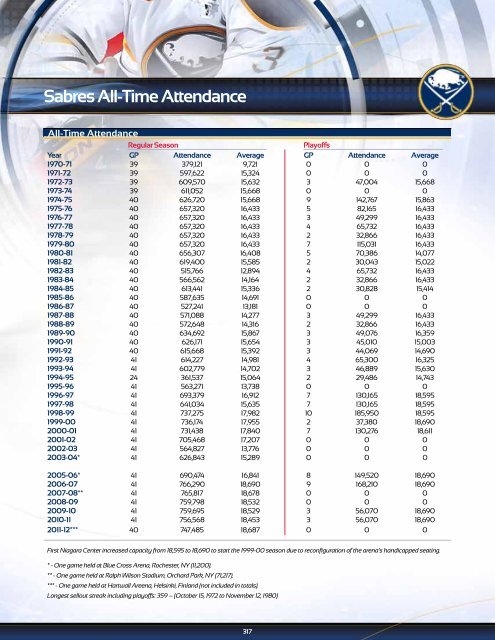
<strong>Sabres</strong> All-Time Attendance<br />
All-Time Attendance<br />
Regular Season Playoffs<br />
Year GP Attendance Average GP Attendance Average<br />
1970-71 39 379,121 9,721 0 0 0<br />
1971-72 39 597,622 15,324 0 0 0<br />
1972-73 39 609,570 15,632 3 47,004 15,668<br />
1973-74 39 611,052 15,668 0 0 0<br />
1974-75 40 626,720 15,668 9 142,767 15,863<br />
1975-76 40 657,320 16,433 5 82,165 16,433<br />
1976-77 40 657,320 16,433 3 49,299 16,433<br />
1977-78 40 657,320 16,433 4 65,732 16,433<br />
1978-79 40 657,320 16,433 2 32,866 16,433<br />
1979-80 40 657,320 16,433 7 115,031 16,433<br />
1980-81 40 656,307 16,408 5 70,386 14,077<br />
1981-82 40 619,400 15,585 2 30,043 15,022<br />
1982-83 40 515,766 12,894 4 65,732 16,433<br />
1983-84 40 566,562 14,164 2 32,866 16,433<br />
1984-85 40 6<strong>13</strong>,441 15,336 2 30,828 15,414<br />
1985-86 40 587,635 14,691 0 0 0<br />
1986-87 40 527,241 <strong>13</strong>,181 0 0 0<br />
1987-88 40 571,088 14,277 3 49,299 16,433<br />
1988-89 40 572,648 14,316 2 32,866 16,433<br />
1989-90 40 634,692 15,867 3 49,076 16,359<br />
1990-91 40 626,171 15,654 3 45,010 15,003<br />
1991-92 40 615,668 15,392 3 44,069 14,690<br />
1992-93 41 614,227 14,981 4 65,300 16,325<br />
1993-94 41 602,779 14,702 3 46,889 15,630<br />
1994-95 24 361,537 15,064 2 29,486 14,743<br />
1995-96 41 563,271 <strong>13</strong>,738 0 0 0<br />
1996-97 41 693,379 16,912 7 <strong>13</strong>0,165 18,595<br />
1997-98 41 641,034 15,635 7 <strong>13</strong>0,165 18,595<br />
1998-99 41 737,275 17,982 10 185,950 18,595<br />
1999-00 41 736,174 17,955 2 37,380 18,690<br />
2000-01 41 731,438 17,840 7 <strong>13</strong>0,276 18,611<br />
2001-02 41 705,468 17,207 0 0 0<br />
2002-03 41 564,827 <strong>13</strong>,776 0 0 0<br />
2003-04* 41 626,843 15,289 0 0 0<br />
2005-06* 41 690,474 16,841 8 149,520 18,690<br />
2006-07 41 766,290 18,690 9 168,210 18,690<br />
2007-08** 41 765,817 18,678 0 0 0<br />
2008-09 41 759,798 18,532 0 0 0<br />
2009-10 41 759,695 18,529 3 56,070 18,690<br />
2010-11 41 756,568 18,453 3 56,070 18,690<br />
2011-12*** 40 747,485 18,687 0 0 0<br />
First Niagara Center increased capacity from 18,595 to 18,690 to start the 1999-00 season due to reconfiguration of the arena’s handicapped seating.<br />
* - One game held at Blue Cross Arena, Rochester, NY (11,200).<br />
** - One game held at Ralph Wilson Stadium, Orchard Park, NY (71,217).<br />
*** - One game held at Hartwall Areena, Helsinki, Finland (not included in totals).<br />
Longest sellout streak including playoffs: 359 -- (October 15, 1972 to November 12, 1980)<br />
317