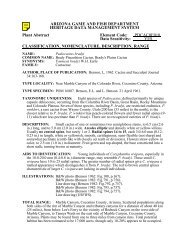
Preacher Canyon Wildlife Fence and Crosswalk Enhancement ...
Preacher Canyon Wildlife Fence and Crosswalk Enhancement ...
Preacher Canyon Wildlife Fence and Crosswalk Enhancement ...

You also want an ePaper? Increase the reach of your titles
YUMPU automatically turns print PDFs into web optimized ePapers that Google loves.
LIST OF TABLES<br />
Table 5.1. Frequency of elk- <strong>and</strong> deer-vehicle collisions along the <strong>Preacher</strong> <strong>Canyon</strong> section<br />
<strong>and</strong> the adjacent Lion Springs section before <strong>and</strong> after completion of fencing <strong>and</strong> a roadside<br />
animal detection system along the <strong>Preacher</strong> <strong>Canyon</strong> section, 2001-2009, State Route 260,<br />
Arizona ...........................................................................................................................................27<br />
Table 5.2. Difference in mean number of EVC on the <strong>Preacher</strong> <strong>Canyon</strong> <strong>and</strong> Lion Springs<br />
sections before (2001−2006) <strong>and</strong> after (2007−2009) modification of fencing <strong>and</strong><br />
implementation of RADS. .............................................................................................................28<br />
Table 6.1. Comparison of three different traffic counters <strong>and</strong> their relationship to radar-gun<br />
speeds for calibration of the traffic counters used to evaluate motorist response .........................31<br />
Table 6.2. Difference in speeds when warning signs were activated or not at the PC<br />
section crosswalk ...........................................................................................................................32<br />
Table 6.3. Reduction (difference) in average vehicle speeds (mph [%]) during weekends <strong>and</strong><br />
weekdays from 2007-2009 at the PC section crosswalk …………. ..............................................33<br />
Table 6.4. Proportion of motorists exhibiting a braking response with <strong>and</strong> without the<br />
motorist alert signs activated in the eastbound, westbound, <strong>and</strong> both lanes combined at the<br />
PC section crosswalk .....................................................................................................................34<br />
Table 6.5. Proportion of motorists exhibiting a braking response with <strong>and</strong> without motorist<br />
alert signs activated during the first (2007) <strong>and</strong> second (2008) years of evaluation at the PC<br />
section crosswalk. ..........................................................................................................................34<br />
Table 6.6. Proportion of motorists exhibiting a braking response with <strong>and</strong> without motorist<br />
alert signs activated during weekends (Friday–Sunday) <strong>and</strong> weekdays (Monday–Thursday) at<br />
the PC section crosswalk. ..............................................................................................................35<br />
Table 7.1. Number of total test visits made from 2007−2009 to the SR 260 RADS <strong>and</strong> the<br />
number (%) of visits where the system was operating properly, displaying false positives, or<br />
when the system was inoperable.. ..................................................................................................38<br />
Table 7.2. Number of elk <strong>and</strong> white-tailed deer that entered the SR 260 RADS detection<br />
zone from the south side <strong>and</strong> approached within 50’ of the roadway (2007−2009) <strong>and</strong> the<br />
number of times that motorist warning signs were activated, activated late, or did not<br />
activate (false negative) ................................................................................................................39<br />
Table 8.1. Number of individuals <strong>and</strong> groups of wildlife recorded on videotape, the number<br />
of times they entered the crosswalk, <strong>and</strong> percentage of times they crossed the highway or<br />
went around the end of the fence at the PC section crosswalk ......................................................43<br />
vii