Causes, Effects and Way Forward to Food Insecurity - Idosi.org
Causes, Effects and Way Forward to Food Insecurity - Idosi.org
Causes, Effects and Way Forward to Food Insecurity - Idosi.org

You also want an ePaper? Increase the reach of your titles
YUMPU automatically turns print PDFs into web optimized ePapers that Google loves.
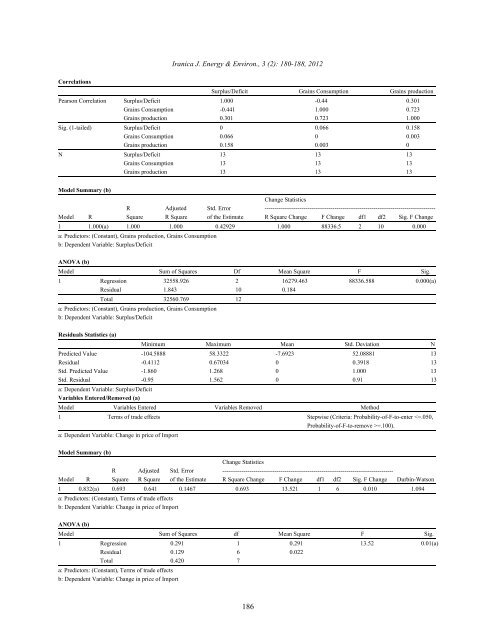
Correlations<br />
Iranica J. Energy & Environ., 3 (2): 180-188, 2012<br />
Surplus/Deficit Grains Consumption Grains production<br />
Pearson Correlation Surplus/Deficit 1.000 -0.44 0.301<br />
Grains Consumption -0.441 1.000 0.723<br />
Grains production 0.301 0.723 1.000<br />
Sig. (1-tailed) Surplus/Deficit 0 0.066 0.158<br />
Grains Consumption 0.066 0 0.003<br />
Grains production 0.158 0.003 0<br />
N Surplus/Deficit 13 13 13<br />
Grains Consumption 13 13 13<br />
Grains production 13 13 13<br />
Model Summary (b)<br />
R Adjusted Std. Error<br />
Change Statistics<br />
----------------------------------------------------------------------------------------<br />
Model R Square R Square of the Estimate R Square Change F Change df1 df2 Sig. F Change<br />
1 1.000(a) 1.000 1.000 0.42929 1.000 88336.5 2 10 0.000<br />
a: Predic<strong>to</strong>rs: (Constant), Grains production, Grains Consumption<br />
b: Dependent Variable: Surplus/Deficit<br />
ANOVA (b)<br />
Model Sum of Squares Df Mean Square F Sig.<br />
1 Regression 32558.926 2 16279.463 88336.588 0.000(a)<br />
Residual 1.843 10 0.184<br />
Total 32560.769 12<br />
a: Predic<strong>to</strong>rs: (Constant), Grains production, Grains Consumption<br />
b: Dependent Variable: Surplus/Deficit<br />
Residuals Statistics (a)<br />
Minimum Maximum Mean Std. Deviation N<br />
Predicted Value -104.5888 58.3322 -7.6923 52.08881 13<br />
Residual -0.4112 0.67034 0 0.3918 13<br />
Std. Predicted Value -1.860 1.268 0 1.000 13<br />
Std. Residual -0.95 1.562 0 0.91 13<br />
a: Dependent Variable: Surplus/Deficit<br />
Variables Entered/Removed (a)<br />
Model Variables Entered Variables Removed Method<br />
1 Terms of trade effects Stepwise (Criteria: Probability-of-F-<strong>to</strong>-enter =.100).<br />
a: Dependent Variable: Change in price of Import<br />
Model Summary (b)<br />
R Adjusted Std. Error<br />
Change Statistics<br />
----------------------------------------------------------------------------------------<br />
Model R Square R Square of the Estimate R Square Change F Change df1 df2 Sig. F Change Durbin-Watson<br />
1 0.832(a) 0.693 0.641 0.1467 0.693 13.521 1 6 0.010 1.094<br />
a: Predic<strong>to</strong>rs: (Constant), Terms of trade effects<br />
b: Dependent Variable: Change in price of Import<br />
ANOVA (b)<br />
Model Sum of Squares df Mean Square F Sig.<br />
1 Regression 0.291 1 0.291 13.52 0.01(a)<br />
Residual 0.129 6 0.022<br />
Total 0.420 7<br />
a: Predic<strong>to</strong>rs: (Constant), Terms of trade effects<br />
b: Dependent Variable: Change in price of Import<br />
186