Molecular genetic responses to lysergic acid ... - Shroomery
Molecular genetic responses to lysergic acid ... - Shroomery
Molecular genetic responses to lysergic acid ... - Shroomery

You also want an ePaper? Increase the reach of your titles
YUMPU automatically turns print PDFs into web optimized ePapers that Google loves.
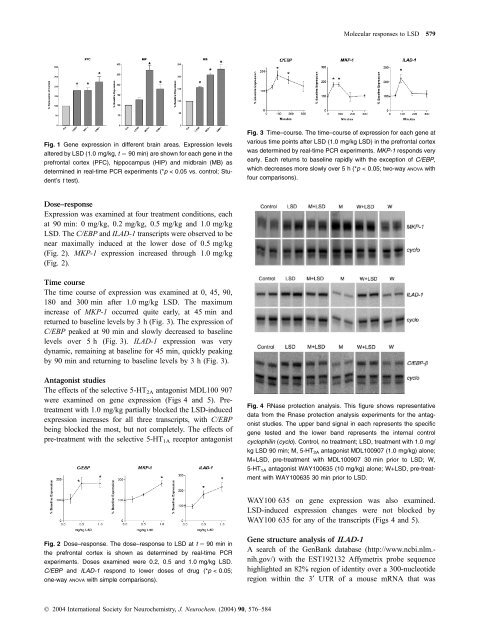
Fig. 1 Gene expression in different brain areas. Expression levels<br />
altered by LSD (1.0 mg/kg, t ¼ 90 min) are shown for each gene in the<br />
prefrontal cortex (PFC), hippocampus (HIP) and midbrain (MB) as<br />
determined in real-time PCR experiments (*p < 0.05 vs. control; Student’s<br />
t test).<br />
Dose–response<br />
Expression was examined at four treatment conditions, each<br />
at 90 min: 0 mg/kg, 0.2 mg/kg, 0.5 mg/kg and 1.0 mg/kg<br />
LSD. The C/EBP and ILAD-1 transcripts were observed <strong>to</strong> be<br />
near maximally induced at the lower dose of 0.5 mg/kg<br />
(Fig. 2). MKP-1 expression increased through 1.0 mg/kg<br />
(Fig. 2).<br />
Time course<br />
The time course of expression was examined at 0, 45, 90,<br />
180 and 300 min after 1.0 mg/kg LSD. The maximum<br />
increase of MKP-1 occurred quite early, at 45 min and<br />
returned <strong>to</strong> baseline levels by 3 h (Fig. 3). The expression of<br />
C/EBP peaked at 90 min and slowly decreased <strong>to</strong> baseline<br />
levels over 5 h (Fig. 3). ILAD-1 expression was very<br />
dynamic, remaining at baseline for 45 min, quickly peaking<br />
by 90 min and returning <strong>to</strong> baseline levels by 3 h (Fig. 3).<br />
Antagonist studies<br />
The effects of the selective 5-HT 2A antagonist MDL100 907<br />
were examined on gene expression (Figs 4 and 5). Pretreatment<br />
with 1.0 mg/kg partially blocked the LSD-induced<br />
expression increases for all three transcripts, with C/EBP<br />
being blocked the most, but not completely. The effects of<br />
pre-treatment with the selective 5-HT 1A recep<strong>to</strong>r antagonist<br />
Fig. 2 Dose–response. The dose–response <strong>to</strong> LSD at t ¼ 90 min in<br />
the prefrontal cortex is shown as determined by real-time PCR<br />
experiments. Doses examined were 0.2, 0.5 and 1.0 mg/kg LSD.<br />
C/EBP and ILAD-1 respond <strong>to</strong> lower doses of drug (*p < 0.05;<br />
one-way ANOVA with simple comparisons).<br />
Ó 2004 International Society for Neurochemistry, J. Neurochem. (2004) 90, 576–584<br />
<strong>Molecular</strong> <strong>responses</strong> <strong>to</strong> LSD 579<br />
Fig. 3 Time–course. The time–course of expression for each gene at<br />
various time points after LSD (1.0 mg/kg LSD) in the prefrontal cortex<br />
was determined by real-time PCR experiments. MKP-1 responds very<br />
early. Each returns <strong>to</strong> baseline rapidly with the exception of C/EBP,<br />
which decreases more slowly over 5 h (*p < 0.05; two-way ANOVA with<br />
four comparisons).<br />
Fig. 4 RNase protection analysis. This figure shows representative<br />
data from the Rnase protection analysis experiments for the antagonist<br />
studies. The upper band signal in each represents the specific<br />
gene tested and the lower band represents the internal control<br />
cyclophilin (cyclo). Control, no treatment; LSD, treatment with 1.0 mg/<br />
kg LSD 90 min; M, 5-HT2A antagonist MDL100907 (1.0 mg/kg) alone;<br />
M+LSD, pre-treatment with MDL100907 30 min prior <strong>to</strong> LSD; W,<br />
5-HT1A antagonist WAY100635 (10 mg/kg) alone; W+LSD, pre-treatment<br />
with WAY100635 30 min prior <strong>to</strong> LSD.<br />
WAY100 635 on gene expression was also examined.<br />
LSD-induced expression changes were not blocked by<br />
WAY100 635 for any of the transcripts (Figs 4 and 5).<br />
Gene structure analysis of ILAD-1<br />
A search of the GenBank database (http://www.ncbi.nlm.nih.gov/)<br />
with the EST192132 Affymetrix probe sequence<br />
highlighted an 82% region of identity over a 300-nucleotide<br />
region within the 3¢ UTR of a mouse mRNA that was