

The Chart Book
The Chart Book
The Chart Book

Create successful ePaper yourself
Turn your PDF publications into a flip-book with our unique Google optimized e-Paper software.
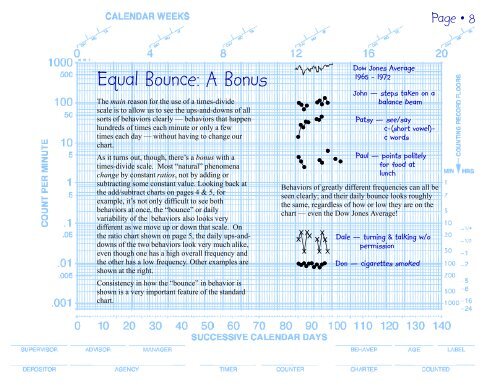
Equal Bounce: A Bonus<br />
<strong>The</strong> main reason for the use of a times-divide<br />
scale is to allow us to see the ups-and-downs of all<br />
sorts of behaviors clearly — behaviors that happen<br />
hundreds of times each minute or only a few<br />
times each day — without having to change our<br />
chart.<br />
As it turns out, though, there’s a bonus with a<br />
times-divide scale. Most “natural” phenomena<br />
change by constant ratios, not by adding or<br />
subtracting some constant value. Looking back at<br />
the add/subtract charts on pages 4 & 5, for<br />
example, it’s not only difficult to see both<br />
behaviors at once, the “bounce” or daily<br />
variability of the behaviors also looks very<br />
different as we move up or down that scale. On<br />
the ratio chart shown on page 5, the daily ups-anddowns<br />
of the two behaviors look very much alike,<br />
even though one has a high overall frequency and<br />
the other has a low frequency. Other examples are<br />
shown at the right.<br />
Consistency in how the “bounce” in behavior is<br />
shown is a very important feature of the standard<br />
chart.<br />
Dow Jones Average<br />
1965 - 1972<br />
John — steps taken on a<br />
balance beam<br />
Patsy — see/say<br />
c-(short vowel)c<br />
words<br />
Paul — points politely<br />
for food at<br />
lunch<br />
Behaviors of greatly different frequencies can all be<br />
seen clearly; and their daily bounce looks roughly<br />
the same, regardless of how or low they are on the<br />
chart — even the Dow Jones Average!<br />
Dale — turning & talking w/o<br />
permission<br />
Don — cigarettes smoked<br />
Page • 8