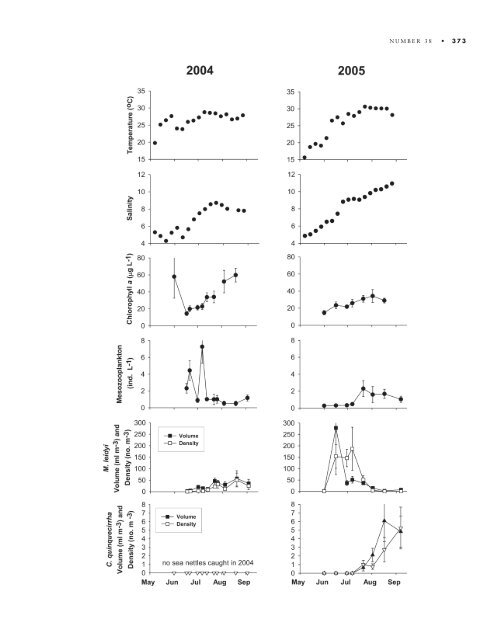
372 • SMITHSONIAN CONTRIBUTIONS TO THE MARINE SCIENCES TABLE 1. Mean environmental conditions measured at each site sampled for 2004 <strong>and</strong> 2005. See Figure 1 for site locations. Chlorophyll a concentrations are whole-water <strong>in</strong>tegrated values (C. Gallegos, SERC); m<strong>in</strong>imum dissolved oxygen (DO) values are based on nearbottom measurements; temperature <strong>and</strong> sal<strong>in</strong>ity are from surface waters (1 m depth); NA site not sampled. Figure 2). Mesozooplankton samples <strong>in</strong> both years were dom<strong>in</strong>ated (95% of <strong>in</strong>dividuals) by the calanoid copepod Acartia tonsa. Dur<strong>in</strong>g 2004, mesozooplankton densities varied signifi cantly among dates (F 6.28, P 0.01). Peak densities of 4– 7 <strong>in</strong>dividuals L 1 occurred on 21 June <strong>and</strong> 7 July <strong>and</strong> then decl<strong>in</strong>ed to approximately 1.0 <strong>in</strong>dividuals L 1 for the rest of the season (see Figure 2). Mnemiopsis leidyi volumes also varied signifi cantly among dates (one-way ANOVA on ranks; F 6.08, P 0.01). Numerical densities <strong>and</strong> volumes were lowest <strong>in</strong> mid-June (0.62 0.25 <strong>in</strong>dividuals m 3 <strong>and</strong> 2.3 0.77 mL m 3 , respectively), <strong>and</strong> then gradually <strong>in</strong>creased to a maximum of 51 30.2 <strong>in</strong>dividuals m 3 <strong>and</strong> 58 33.5 mL m 3 on 19 August (see Figure 2), the date that co<strong>in</strong>cided with highest densities of “recruits” (<strong>in</strong>dividuals 1 cm <strong>in</strong> length). Regression analyses <strong>in</strong>dicated a signifi cant relationship between the zooplankton density of the prior week <strong>and</strong> both M. leidyi volume (r 2 0.13, P 0.01) <strong>and</strong> the density of recruits (r 2 0.21, P 0.01). However, the previous week’s chl a concentration expla<strong>in</strong>ed a greater percentage of the variation <strong>in</strong> both these measures of M. leidyi abundance for the sites at which chl a data were available (1A, 2A, 3A, 4B) (volume: r 2 0.33, P 0.01; density of new recruits: r 2 0.25, P 0.01). Chrysaora qu<strong>in</strong>quecirrha abundances were low dur<strong>in</strong>g 2004. A few medusae were seen <strong>in</strong> the fi eld dur<strong>in</strong>g August <strong>and</strong> early September but were never caught with either the 0.5 m diameter hoop net or the larger 1 m 2 neuston net, which was deployed <strong>in</strong> an attempt to more accurately sample the low-density C. qu<strong>in</strong>quecirrha population. 2004 2005 Chlorophyll a M<strong>in</strong>imum DO Temperature Chlorophyll a M<strong>in</strong>imum DO Temperature Site (g L 1 ) (mg L 1 ) (°C) Sal<strong>in</strong>ity (g L 1 ) (mg L 1 ) (°C) Sal<strong>in</strong>ity 73 a NA 2.31 25.40 7.76 NA 3.46 26.26 9.79 1A 24.55 5.20 25.95 8.20 21.37 6.61 26.64 9.26 2A 24.76 5.77 26.66 8.04 37.02 6.88 27.58 9.44 CC NA 4.70 29.14 7.35 NA 5.14 28.91 9.10 3A 32.43 4.73 27.54 7.94 28.20 5.21 28.00 8.87 SC NA 4.23 28.09 7.78 NA 5.31 27.97 9.38 4B 44.34 5.22 28.41 7.29 32.29 5.19 28.62 9.08 a Because of sea conditions, site 73 was not sampled dur<strong>in</strong>g mid- to late summer 2004 as frequently as other sites; thus, averages are not necessarily representative of physical conditions at site 73 relative to other sites measured on the same dates. 2005 BIOTA Temporal patterns <strong>and</strong> peak abundances of most biota <strong>in</strong> 2005 differed from those <strong>in</strong> 2004 (see Figure 2). Mid-June chl a concentrations <strong>in</strong> 2005 were similar to those <strong>in</strong> the correspond<strong>in</strong>g time period <strong>in</strong> 2004, <strong>and</strong> as <strong>in</strong> 2004 generally <strong>in</strong>creased dur<strong>in</strong>g the rema<strong>in</strong>der of the season. However, sampl<strong>in</strong>g did not detect an early June chl a peak <strong>in</strong> 2005, <strong>and</strong> maximum chl a concentrations <strong>in</strong> late summer 2005 reached only about two-thirds the concentrations reached <strong>in</strong> 2004 (Figure 2). Mesozooplankton densities varied among dates (one-way ANOVA on ranks, F 4.87, P 0.01). The 21 July peak density of 2.3 <strong>in</strong>dividuals L 1 was both later <strong>and</strong> lower than peak densities <strong>in</strong> 2004. Early June through early July mesozooplankton densities rema<strong>in</strong>ed below 1 <strong>in</strong>dividual L 1 <strong>and</strong> were similar to mid-July– early September densities <strong>in</strong> 2004. The tim<strong>in</strong>g of the <strong>in</strong>crease <strong>in</strong> mesozooplankton densities <strong>in</strong> 2005 corresponded to a decrease <strong>in</strong> M. leidyi densities <strong>and</strong> the appearance of C. qu<strong>in</strong>quecirrha. M. leidyi densities varied signifi cantly among dates (one-way ANOVA on ranks: F 13.98, P 0.01). Peak M. leidyi FIGURE 2. (fac<strong>in</strong>g page) Weekly mean temperature (°C) <strong>and</strong> sal<strong>in</strong>ity at the SERC dock (C. Gallegos, unpublished data), <strong>and</strong> river-wide mean (SE) chlorophyll a concentration (g L 1 ), mesozooplankton abundance (number L 1 ), <strong>and</strong> Mnemiopsis (M.) leidyi <strong>and</strong> Chrysaora (C.) qu<strong>in</strong>quecirrha abundance (volume, mL m 3 ; density, number m 3 ) for 2004 (left) <strong>and</strong> 2005 (right).
NUMBER 38 • 373